


Playground with Prometheus, Grafana, Loki and k6
Step-by-Step guide to setup a testing environment with consistent load.


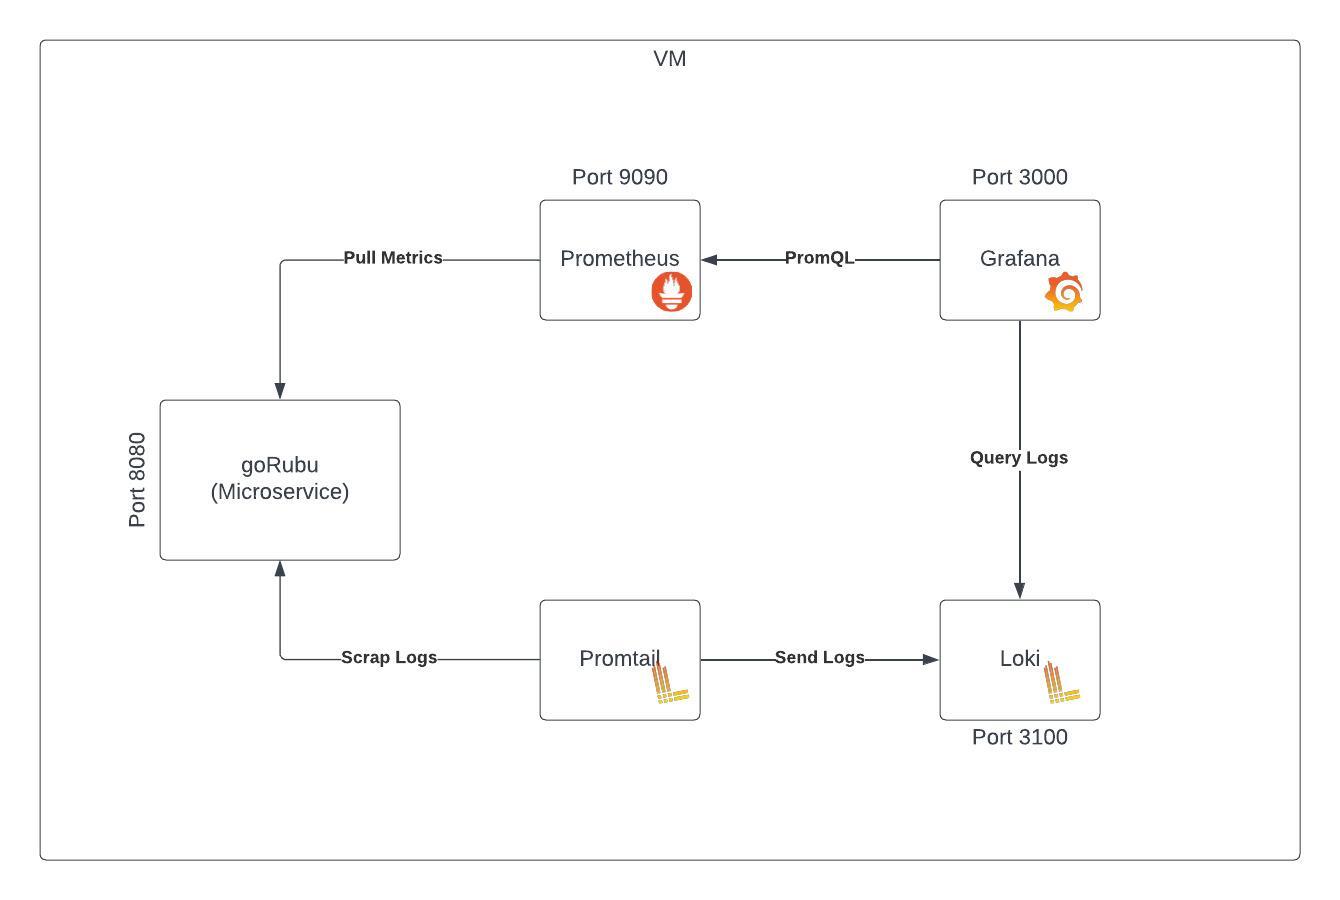
In this blog, we will set up a VM with a testing playground. This playground will have a microservice, with Prometheus, Grafana and Loki for runtime metrics and log observability and k6 for generating a constant load. It can be used for measuring the capabilities of your microservice, or for benchmarking your tools.
Context
I’ve been following Doctor Droid for a bit and have been in touch with Founders to try their product. I recently started Zurich Lab, a tech consultancy, to explore different opportunities - so I hit them up and it turns out they were looking for someone for a project (win-win!).
Setup
Doctor Droid is an observability tool to auto-diagnose production issues with engineer-created playbooks. To test out their tool, they needed a few sandbox environments, with one or 10s of microservices, with syntactic points of failure and some chaotic traffic and ways to monitor the environment. We decided to start with a single microservice, which can be expanded to multiple.
Here’s how we went about doing it
Step 1: Provision VM.
Step 2: Setup the observability environment.
Step 3: Setup the microservice
Step 4: Setup traffic simulation with k6.
Conclusion: Explore metrics in Grafana.
Below are the details for all the steps
Step 1: Provision VM.
We have the provision of an EC2 instance, with 4GB RAM and any basic CPU available, in our case, it’s Intel Xeon E5-2686 v4 (2) @ 2.299GHz, with Ubuntu 22. You can either use Multipass to have a local VM or provision a VM on by any cloud provider. Not recommended, but you can also use your own Ubuntu machine to do the same setup, which will make permanent changes to your system, which can be undone, but we have not covered that in this blog. :)
Step 2: Setup the observability environment
First, we will set up each part individually.
Prometheus
Get the latest release of Prometheus, and unzip it.
  wget https://github.com/prometheus/prometheus/releases/download/v2.37.6/prometheus-2.37.6.linux-amd64.tar.gz

  tar xvfz prometheus-*.tar.gz

  rm prometheus-*.tar.gz
Move the Prometheus binary to local/bin, and make etc and lib folder for Prometheus.
  cd prometheus-2.37.6.linux-amd64
  sudo mv prometheus promtool /usr/local/bin/

  sudo mkdir /etc/prometheus /var/lib/prometheus
  sudo mv prometheus.yml /etc/prometheus/prometheus.yml
  sudo mv consoles/ console_libraries/ /etc/prometheus/

  prometheus --version
Add Prometheus to the user, and change permission of the folders.
  sudo useradd -rs /bin/false prometheus
  sudo chown -R prometheus: /etc/prometheus /var/lib/prometheus
Add Prometheus to systemd, so it runs in the background.
  sudo "[Unit]
      Description=Prometheus
      Wants=network-online.target
      After=network-online.target

      [Service]
      User=prometheus
      Group=prometheus
      Type=simple
      Restart=on-failure
      RestartSec=5s
      ExecStart=/usr/local/bin/prometheus \
          --config.file /etc/prometheus/prometheus.yml \
          --storage.tsdb.path /var/lib/prometheus/ \
          --web.console.templates=/etc/prometheus/consoles \
          --web.console.libraries=/etc/prometheus/console_libraries \
          --web.listen-address=0.0.0.0:9090 \
          --web.enable-lifecycle \
          --log.level=info

      [Install]
      WantedBy=multi-user.target" > /etc/systemd/system/prometheus.service

  sudo systemctl daemon-reload
  sudo systemctl enable prometheus
  sudo systemctl start prometheus
  sudo systemctl status prometheus
Prometheus should be up and running now!
Loki
Get the latest release of Loki, unzip it and create a symlink for binary to local/bin.
sudo mkdir /opt/loki | cd /opt/loki
sudo wget -qO /opt/loki/loki.gz "https://github.com/grafana/loki/releases/download/v2.9.5/loki-linux-amd64.zip"


sudo gunzip /opt/loki/loki.gz
sudo chmod a+x /opt/loki/loki


sudo ln -s /opt/loki/loki /usr/local/bin/loki
Get Loki configuration files.
sudo wget -qO /opt/loki/loki-local-config.yaml "https://raw.githubusercontent.com/grafana/loki/v2.9.5/cmd/loki/loki-local-config.yaml"
Add Loki service to systemd.
sudo "[Unit]
Description=Loki log aggregation system
After=network.target


[Service]
ExecStart=/opt/loki/loki -config.file=/opt/loki/loki-local-config.yaml
Restart=always


[Install]
WantedBy=multi-user.target" > /etc/systemd/system/loki.service


sudo systemctl daemon-reload
sudo systemctl enable loki
sudo systemctl start loki
sudo systemctl status loki
Get Promtail, is the agent, responsible for gathering logs and sending them to Loki. We will get the latest release, and create a symlink for binary to local/bin.
cd /opt/loki
sudo wget -qO /opt/loki/loki-local-config.yaml"https://github.com/grafana/loki/releases/download/v2.9.5/promtail-linux-amd64.zip"


sudo unzip promtail-linux-amd64.zip
sudo rm -r promtail-linux-amd64.zip
sudo chmod a+x promtail-linux-amd64

sudo ln -s /opt/loki/promtail-linux-amd64 /usr/local/bin/promtail
Add promtail configuration.
sudo "[Unit]
Description=Promtail service
After=network.target


[Service]
Type=simple
ExecStart=/usr/local/bin/promtail -config.file /opt/loki/promtail-config.yaml


[Install]
WantedBy=multi-user.target" > /etc/systemd/system/promtail.service

sudo systemctl daemon-reload
sudo systemctl enable promtail
sudo systemctl start promtail
sudo systemctl status promtail
Loki should be up now, and should start ingesting logs from Promtail!
Grafana
Get the latest release of Grafana, and unzip it.
sudo apt-get install -y apt-transport-https software-properties-common
sudo wget -q -O /usr/share/keyrings/grafana.key https://apt.grafana.com/gpg.key
echo "deb [signed-by=/usr/share/keyrings/grafana.key] https://apt.grafana.com stable main" | sudo tee -a /etc/apt/sources.list.d/grafana.list

sudo apt-get update
sudo apt-get install grafana -y
The above steps have added a Grafana Server service to the systems, but we need to enable it.
sudo apt-get update
sudo apt-get install grafana -y
sudo systemctl daemon-reload
sudo systemctl enable grafana-server.service
sudo systemctl start grafana-server
sudo systemctl status grafana-server
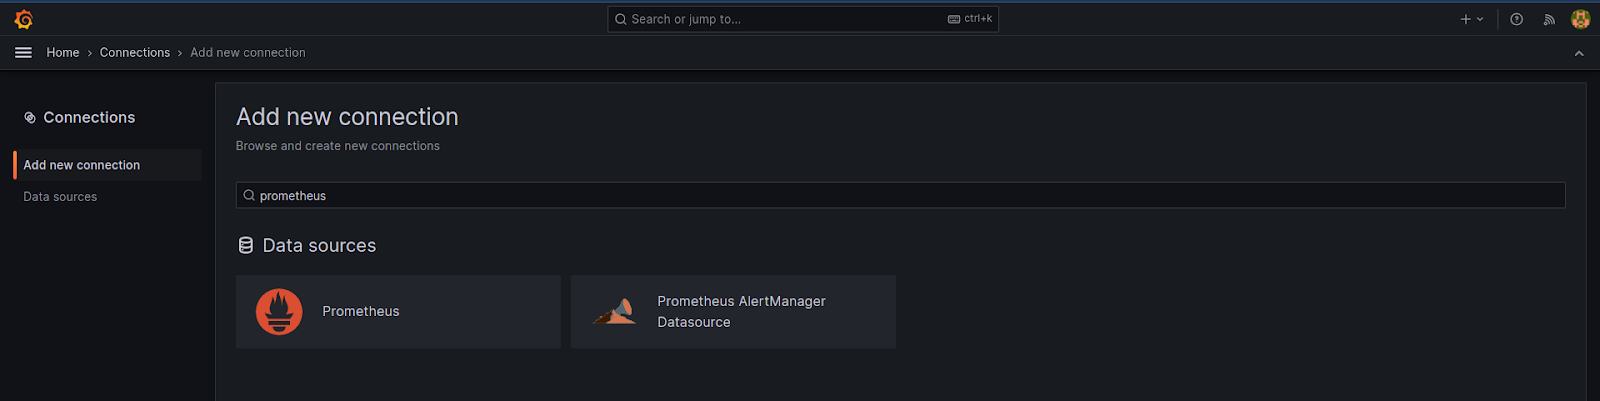
Add Prometheus as a data source in Grafana.
Go to your public IP, and open port 3000.
This will open the Grafana login page for you.
Use "admin" as both username and password.
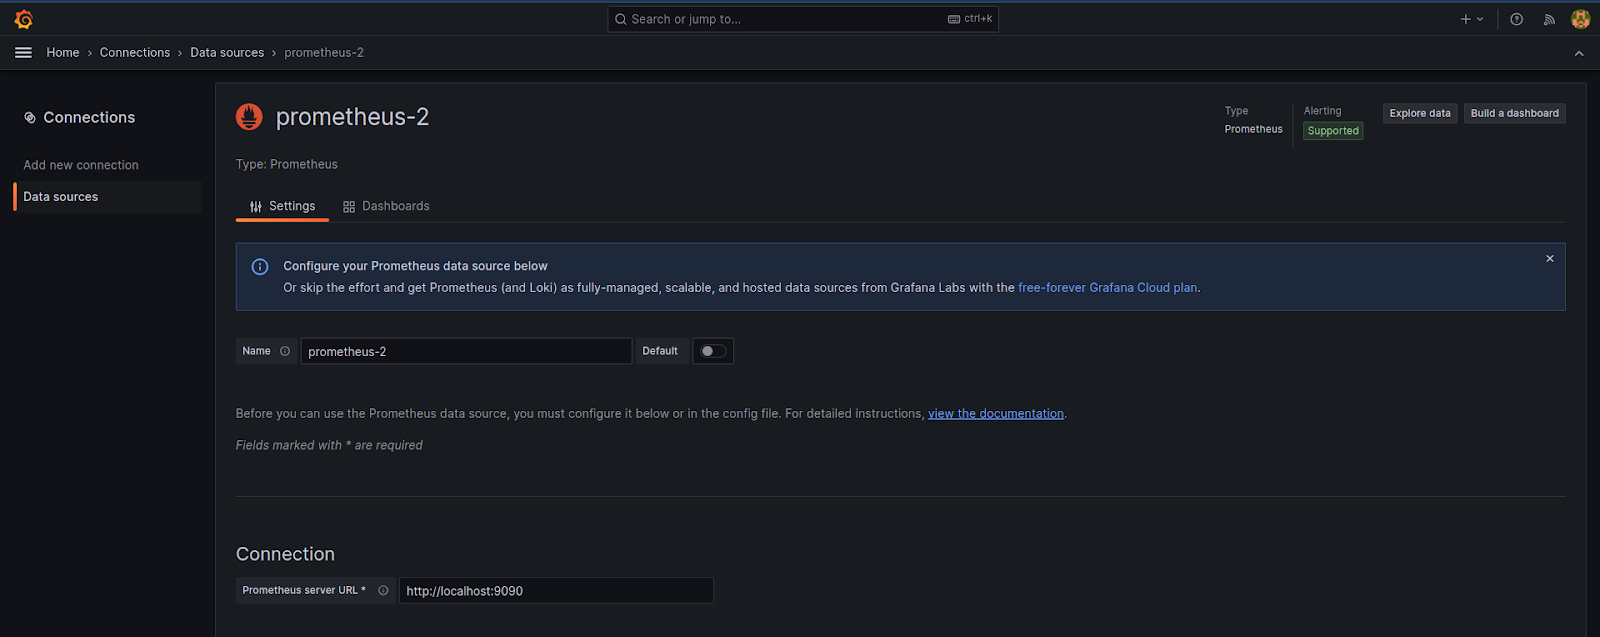
Use the datasource open there, and add Prometheus in it, by pointing to http://localhost:9090, and save.
You can follow a detailed description of the same here(https://grafana.com/docs/grafana/latest/datasources/).
Add Loki as a data source in Grafana.
- It follows the same steps as above, but when selecting the data source, select Loki, and point to http://localhost:3100.
Grafana should be up and running now! It should also have access to both Loki and Prometheus data.
Step 3: Setup the microservice
For our test, we have selected GoRubu repo, because it already has Prometheus integrated, and was small and simple enough to make changes.
We also made some changes in the service, like adding our custom instrumentation, parameterising the config files path, adding different points of failures, and random response time to APIs. However, we won’t cover that in this blog.
Runtime Environment
We will first set up the runtime environment for this project. Which requires Golang, Mongo and Memcached. Let’s install and run them.
  sudo apt install golang-go memcached make gnupg curl -y

  curl -fsSL https://www.mongodb.org/static/pgp/server-7.0.asc | \
  sudo gpg -o /usr/share/keyrings/mongodb-server-7.0.gpg --dearmor

  echo "deb [ arch=amd64,arm64 signed-by=/usr/share/keyrings/mongodb-server-7.0.gpg ] https://repo.mongodb.org/apt/ubuntu jammy/mongodb-org/7.0 multiverse" | sudo tee /etc/apt/sources.list.d/mongodb-org-7.0.list

  sudo apt-get update
  sudo apt-get install -y mongodb-org
  sudo systemctl daemon-reload
  sudo systemctl enable mongod
  sudo usrmod -aG sudo mongodb
  sudo systemctl start mongod
Let’s clone the repo and run it. We will compile it, so we can run it later.
  git clone https://github.com/rv404674/goRubu.git
  cd goRubu
  go run .
  go build
Run in background
Add service to the systemd, so it can auto-restart and run in the background.
  sudo "[Unit]
  Description=backend-service
  After=network.target
  StartLimitIntervalSec=0
  [Service]
  Type=simple
  Restart=always
  RestartSec=1
  User=ubuntu
  ExecStart=/home/ubuntu/goRubu

  [Install]
  WantedBy=multi-user.target" > /etc/systemd/system/rubu.service

  sudo systemctl daemon-reload
  sudo systemctl enable rubu
  sudo systemctl start rubu
  sudo systemctl status rubu
Metrics & Logs Target
Service is running in the systemd, so the logs are auto-collected for it by Promtail!
Let’s add the service to the scrape config of Prometheus. Add the following to /etc/prometheus/prometheus.yaml
  - job_name: "robu"
    static_configs:
      - targets: ["localhost:8080"]
Step 4: Setup traffic simulation with k6.
Now that all the services are running, we are ready to install and set up k6, to generate periodic load we will set up a cron job for it.
K6
Let’s install k6.
sudo gpg -k
sudo gpg --no-default-keyring --keyring /usr/share/keyrings/k6-archive-keyring.gpg --keyserver hkp://keyserver.ubuntu.com:80 --recv-keys C5AD17C747E3415A3642D57D77C6C491D6AC1D69

echo "deb [signed-by=/usr/share/keyrings/k6-archive-keyring.gpg] https://dl.k6.io/deb stable main" | sudo tee /etc/apt/sources.list.d/k6.list

sudo apt-get update
sudo apt-get install k6
Load generation script
Let’s write a script to generate the load. Below is the javascript code for it. Let’s name it load.js
import http from 'k6/http';
import { check, sleep } from 'k6';

export const options = {
        stages: [
                { duration: '15s', target: 200},
                { duration: '15s', target: 500},
        ],
}

export default function () {
        const shorten_url = "http://localhost:8080/all/shorten_url"
        const redirect = "http://localhost:8080/all/redirect"
        const payload = JSON.stringify({
                Url: "https://google.com"
        });

        const params = {
                headers: {
                        'Content-Type': 'application/json',
                        'Authorization': 'Bearer TOKEN'
                }
        };

        const res = http.post(shorten_url, payload, params);
        const res2 = http.post(redirect, payload, params);
        check(res, {'status was 200': (r) => r.status == 200})
        check(res2, {'status was 200': (r) => r.status == 200})
}
Let’s run the above script. You can read more about k6 here.
k6 run --vus 10 --duration 30s -o experimental-prometheus-rw load.jsk6 run --vus 10 --duration 30s -o experimental-prometheus-rw load.jsk6 run --vus 10 --duration 30s -o experimental-prometheus-rw load.js
Cron Load Generation
We will use crontab to set up a cron job. Let’s install it.
sudo apt install crong
sudo systemctl enable cron
sudo systemctl start cron
Let’s write a load script, which we will trigger every minute. Let’s name it generate_load.sh. This will trigger the k6 command, with our load.js file. It generates the load for 30 minutes.
#!/bin/sh


k6 run --vus 5 --duration 30s -o experimental-prometheus-rw ~/load.js > k6_logs.log
Let’s add our generate_load.sh to crontab.
crontab -e


// Add following line in the end of the file
// It sets the cron time, and the file to run.
* * * * * /usr/bin/sh ~/PATH/generate_load.sh
That’s all, this will generate a periodic and consistent load to our service.
Conclusion
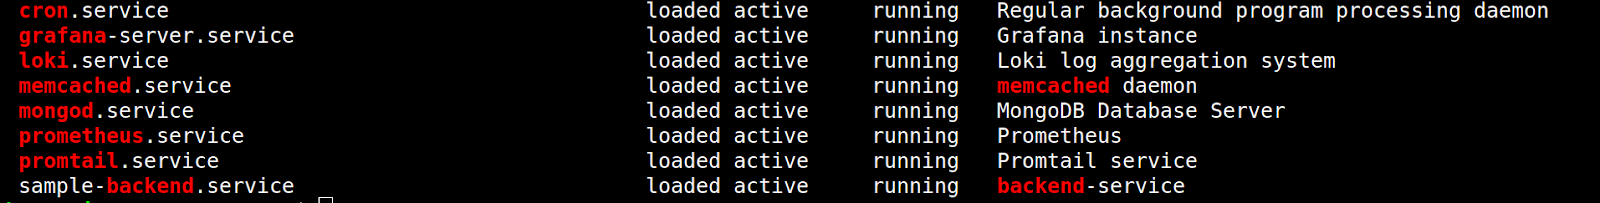
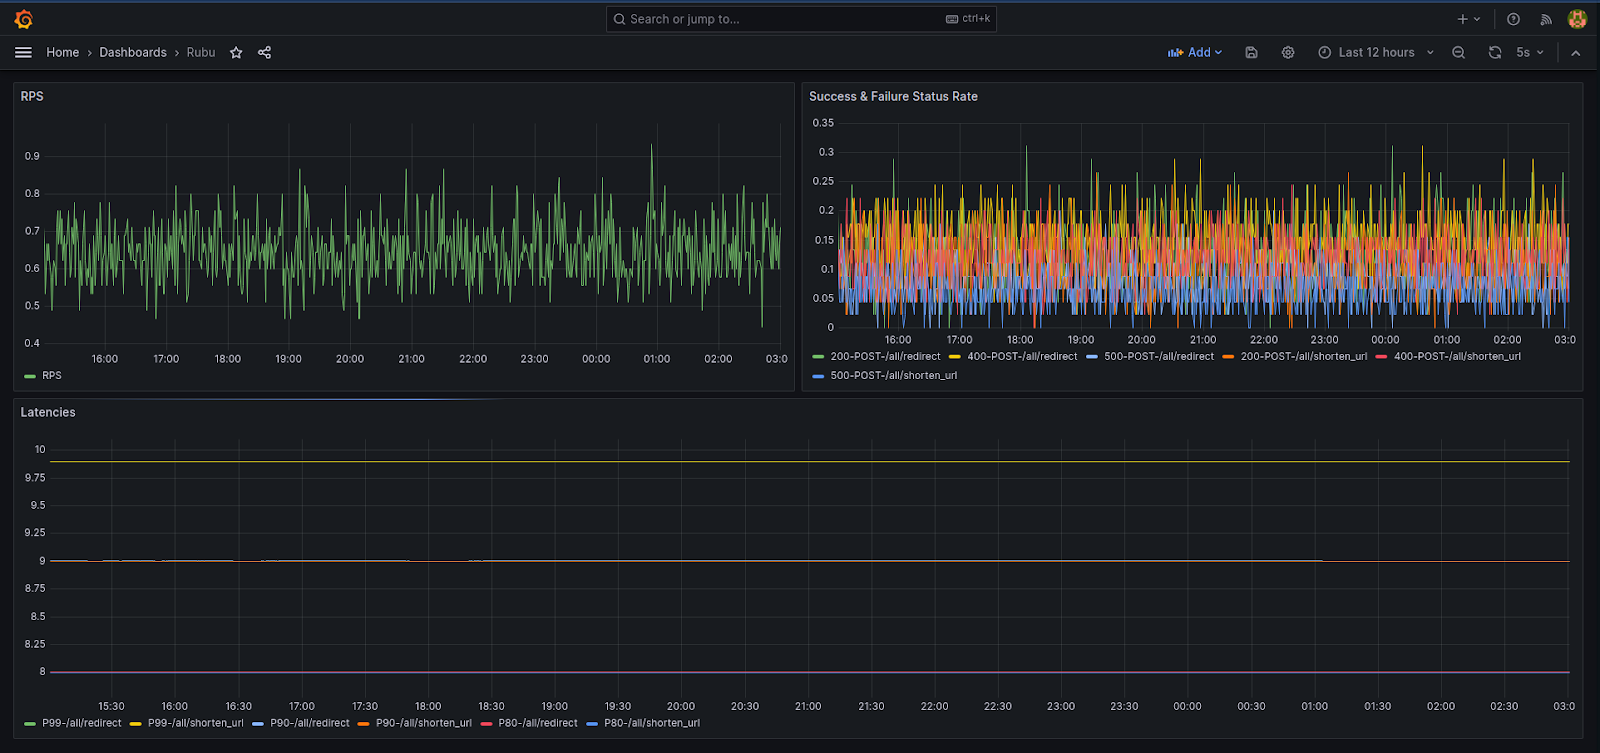
All the required services are active and running, which you can find in the systemctl.
Here is how the traffic looks in the Grafana.
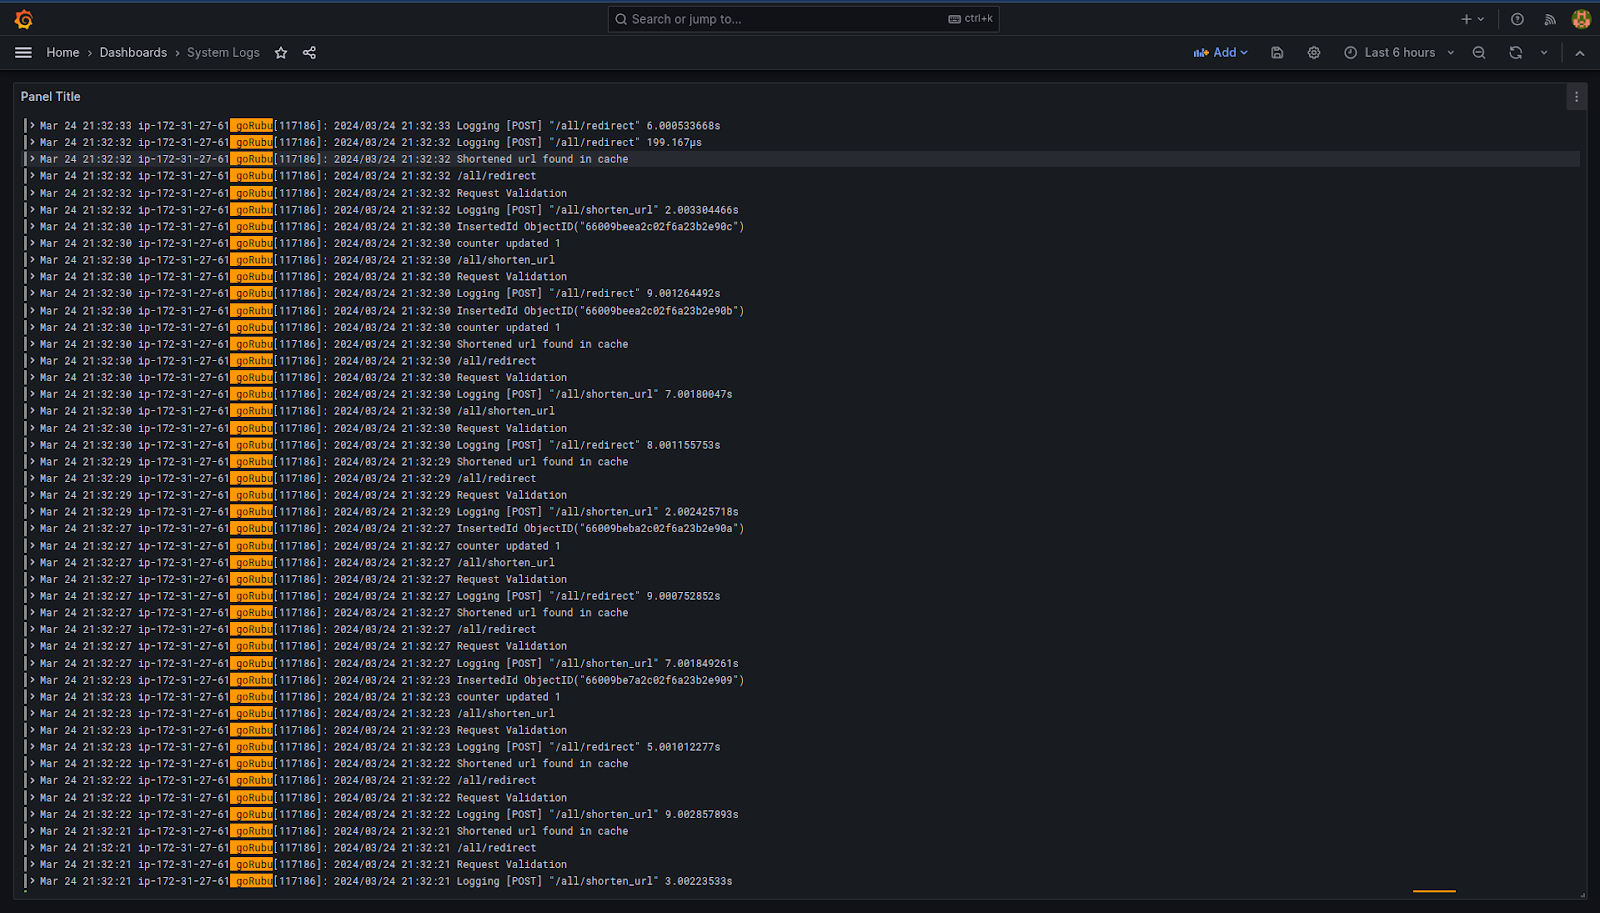
Here is how the logs look in the Grafana.
With that, you have your playground running in the VM, feel free to tune the service for the scenario you want, or maybe try adding multiple services, to test multi-service dependency.
Thank you for reading this blog, do drop any feedback or questions you might have!
Happy engineering :)