
API callback & webhooks monitoring
Learn the best practices for monitoring webhook callbacks and safeguarding your application against disruptions and errors.
Software Developer | Debugger
Webhooks are crucial components of a multi-system architecture. They enable one application to send automated messages or notifications to another application when a certain event occurs, without the need for constant polling. Hence, monitoring them is super important.
At Doctor Droid, we are enabling API callback monitoring through a context-based linking between events. To try it out, sign up here.
In this blog, I’m going to walk you through how you can monitor webhooks so that your user experience is never compromised.
The 3 different types of webhooks to monitor
FYI webhooks (e.g. SMS got delivered)
These webhooks are stored for future analysis and performance measurement and do not trigger real-time actions.
Critical webhooks (e.g. Payment completed)
Essential webhooks play a crucial role in enabling product flow and directly impact the customer experience. These types of webhooks typically require immediate attention and should trigger alerts to ensure timely response and resolution.
Human action webhooks (e.g. third-party vendor updates)
These are vital for monitoring operational activities and may have some indirect impacts on the system's triggers.
Important practices to follow when building webhooks
The aim here is to build secure and efficient webhooks to create an application that provides a seamless user experience. Here are some of the best practices for you to follow:
Keep a fallback for polling the caller
There could be situations where the calling application is unable to make those calls. It’s recommended to keep a fallback handy where after a certain time from the forward call, you poll that application for the same data that they may have sent you the webhook with.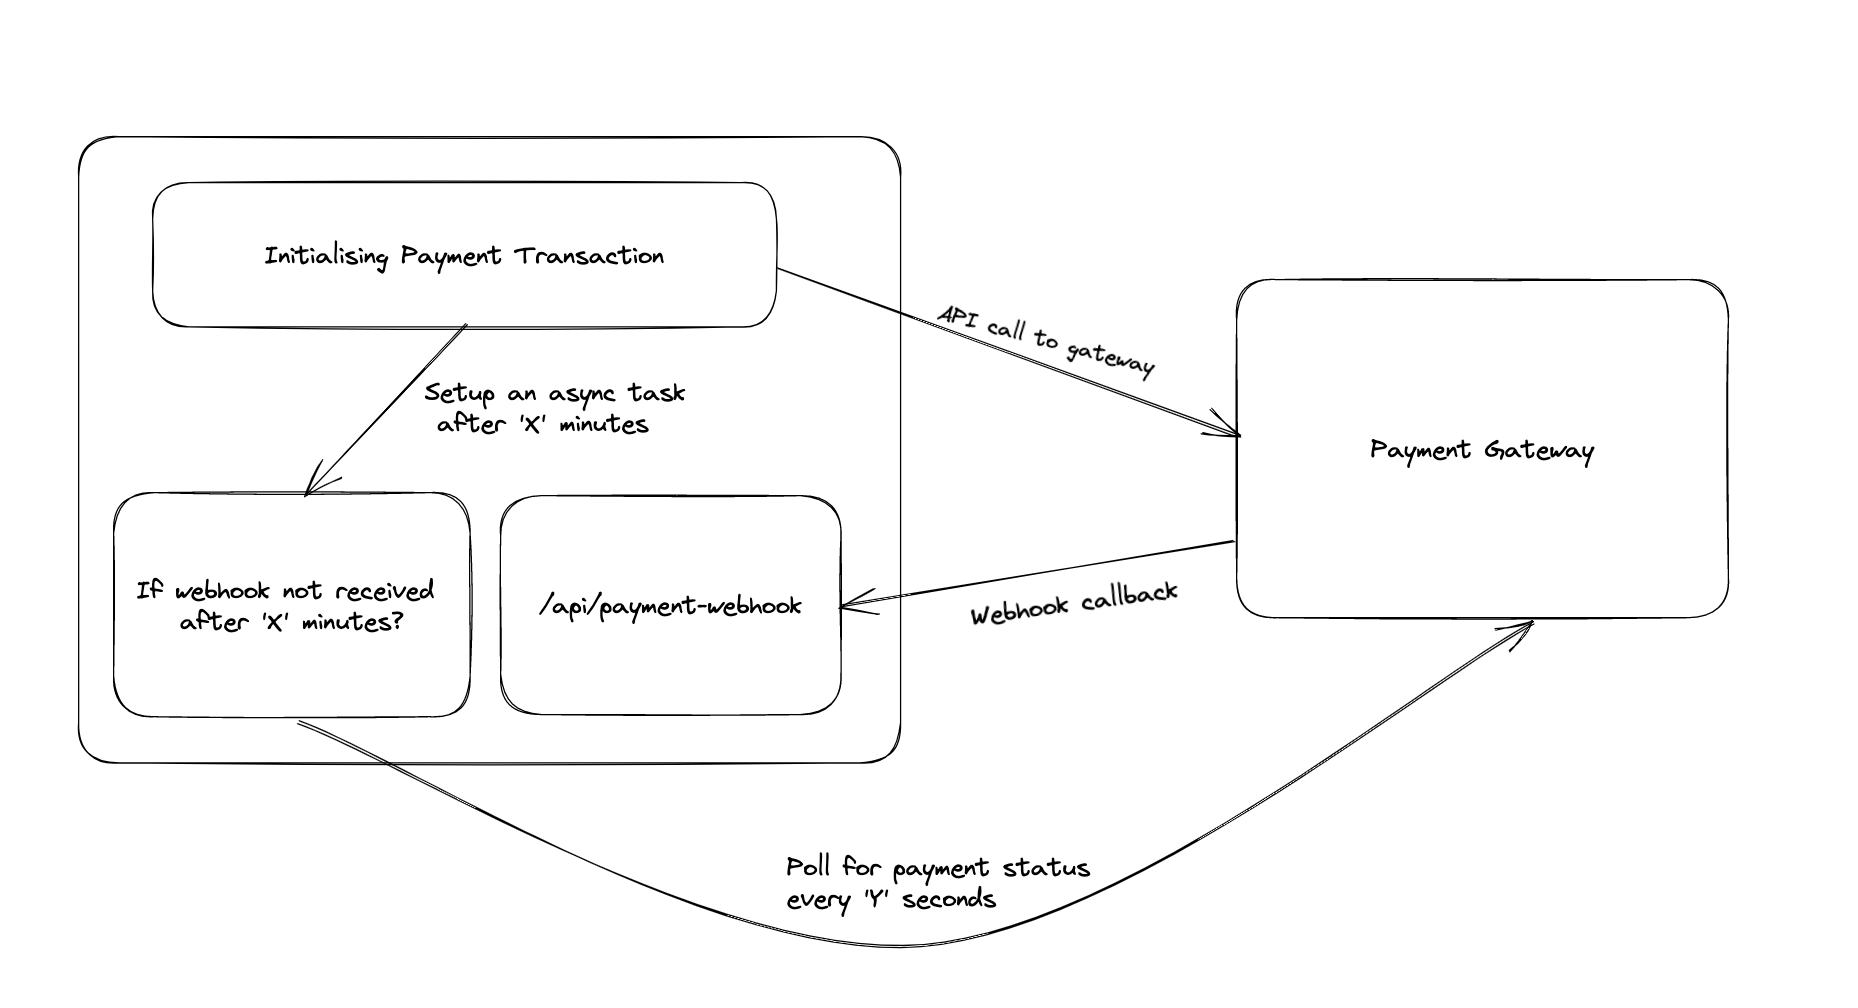
This makes sure your product journey remains intact. However, if their application is not working then this won’t be useful. You should make a note internally (or alert) if this polling fails to yield the desired output.
Always put validations for request schema coming into your application
The trick here is to only read those fields which are relevant to you and discard the rest. If this integration is important for financial reconciliation in the future, keep a copy of the incoming webhook requests in some persistent storage.This will also help in case of a callback request failure, as you'll have a copy of the original request to refer to.
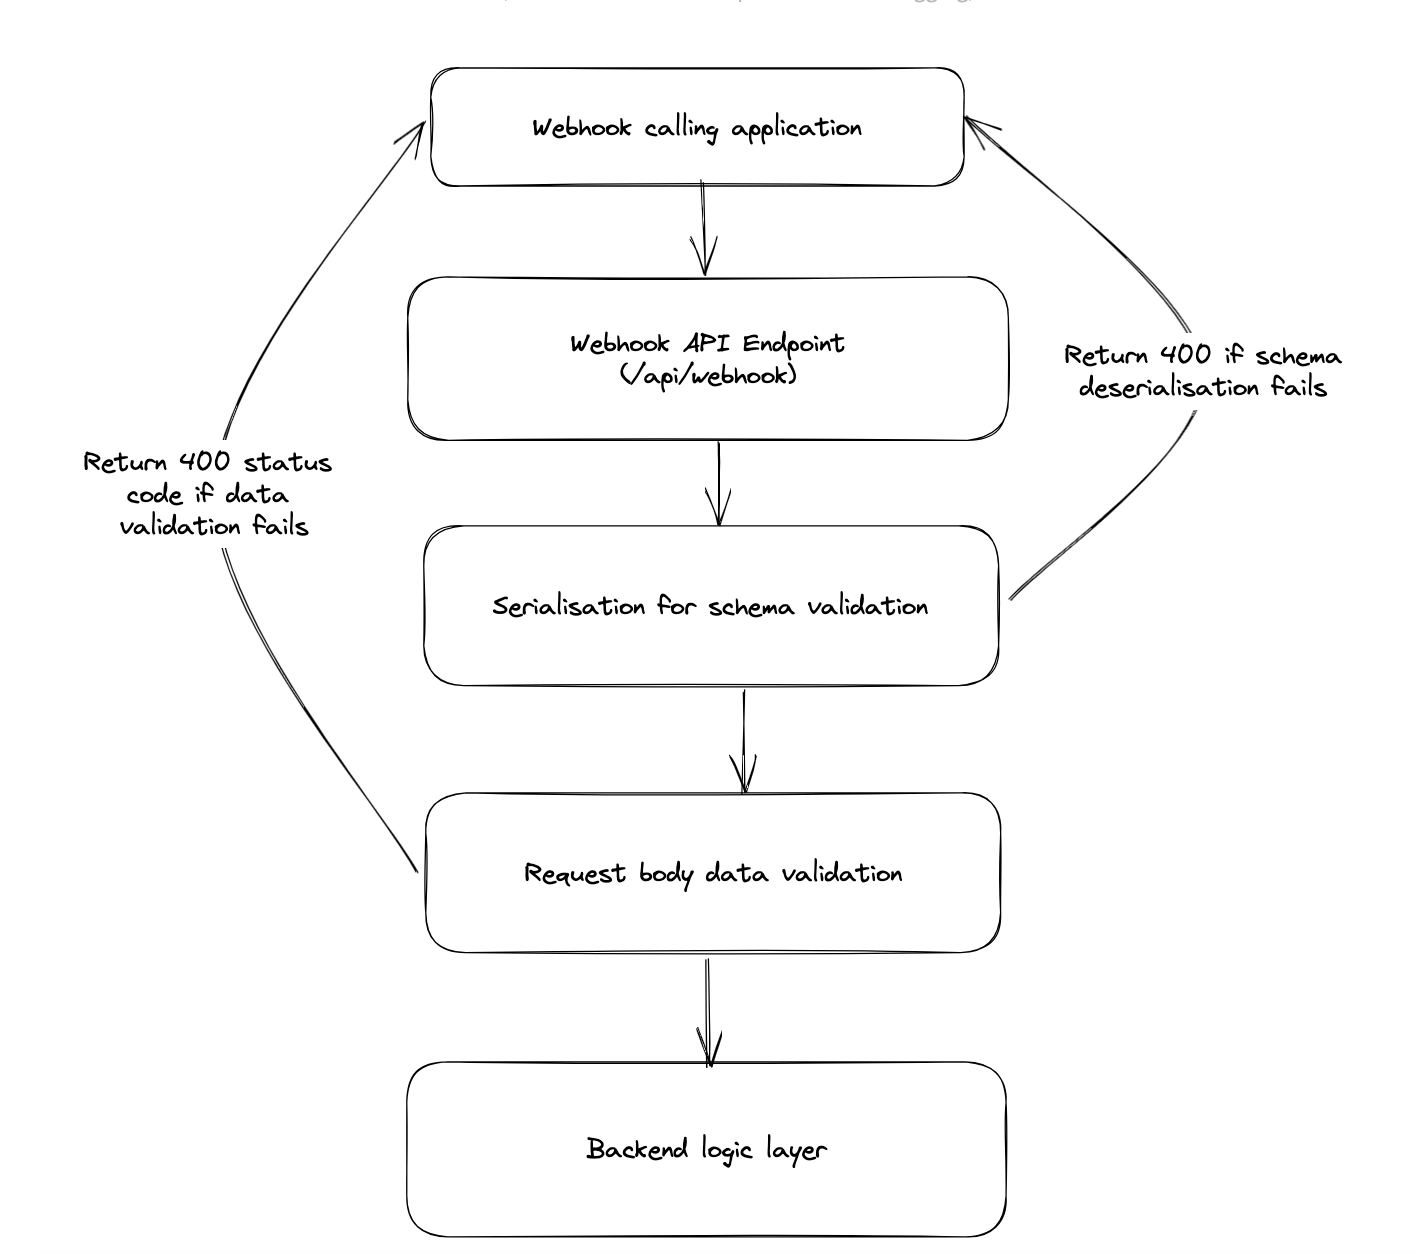
Throw alerts for deserialization errors in webhook requests
Since this application is not under your control, there is a rare but possible chance they may change their request schema without prior intimation. To make sure you are aware of this when it happens, set up error handling at your deserialization and request validation layer.Make the caller aware of your response status
When handling webhooks, it's important to consider how failures are handled, specifically in the case of validation errors or serialization errors. Webhooks are typically called in a "fire-and-forget" mode, meaning that the caller may not be aware of any breakage in the webhook request data.This can lead to the receiver suffering from issues without the caller being aware of them. To prevent this, it's crucial to make sure that the caller is aware of the response status to ensure proper communication and handling of errors.
There are 2 ways you can monitor these webhooks
Stateless monitoring
For high-traffic webhooks, like telephony callbacks on SMS delivery, you can measure overall behaviour by counting and analyzing a field in the webhook API request. No need to map it to the original request.
Stateful monitoring
To track the entity for which the callback is received, map the callback status from the bank to the transaction initiated via API. Alerts should be set up for missed or delayed webhook calls, as this helps to take further actions to maintain customer experience and product journey. There are two ways you can set up alerts:
At an individual level
You need to be informed of the duration for which each webhook has been missed. There’s little tolerance for failure due to the severe repercussions that can be inflicted and so every failure needs to be reported and investigated.
For example, in the financial world, the processing of payments can’t be paused or delayed unless there’s a problem at the recipient’s bank, but that also must be known at the earliest possible time.
At aggregated level
In this situation, you know some leakage is happening but there’s a tolerance range. To monitor potential leakage within an acceptable range, track webhooks against orders in your system, such as those fulfilled by third-party vendors. Although real-time performance monitoring may not be feasible, you can still ensure that the performance doesn't deteriorate beyond a specified threshold.
How do you set up the monitoring process?
For stateless monitoring
a. Use logs
Add logs for each request coming in and the field in it that defines success/failure (or whatever state matters to you). Take these logs into Grafana Loki or ELK stack and plot the count and the trend of that status value. This will be limited with the retention period of your logs so not good if you want to look at very old performance data also.b. Store in DB
Put the webhook call data into a DB of your choice as an immutable entry. Plot this using any data visualization tool you want to use like Sisense, Metabase, or Redash. This data could remain forever. You can archive this into s3 as parquet files every week and move older queries onto the s3 + athena stack.c. Metrics
Keep counters for each incoming request and another counter for each success and failure status. Use Prometheus to scrape them and then see them in any observability tool of your choices like Grafana or commercial tools like Newrelic or Datadog. This again is limited by data retention. Tools like chronosphere allow you to resample the data by coalescing it for the past so you can enjoy longer retention but with reduced granularity over time.For stateful monitoring
There is no easy way to monitor this. You want to keep the reference of your forward transaction when receiving or waiting for the webhook and map this behaviour onto alerts or charts.
a. Using logs
You can log forward and incoming webhook calls with some common log_message that can help link them when searching and plotting. You can use an id to represent the entity in question, but you can search both logs or the lack of the webhook by searching for that ID. This can be done in any log visualization tool. However, if you want to do this in aggregation, the logging solutions fall short.b. Store in DB
You store both forward and webhook transactions into a DB and run periodic queries for the webhook being missed. This can be used to know of each failure (with the periodic query running every few seconds) or in aggregation every ‘X’ minutes. This can then be plotted on a chart or sent in a notification. These features exist in data visualization tools like Metabase, Superset, Sisense. You may not want to run these periodic queries on your OLTP DB, so you may want to replicate it or set up an ETL pipeline to make a data lake and then run these queries on it like Snowflake. Making this in-house is not only tedious but also adds a lot of DevOps overhead. Using a cloud solution for this is simply too expensive.
Quick note: Dr Droid specializes in the stateful monitoring of products. Sign up here to get started.
3 Ways you can fix your webhooks before contacting the application owner
If the number of webhooks is dropping, do the following:
a. Inspect the forward action that causes webhook calls. Maybe your forward action itself is breaking or not happening, causing the application to not trigger callback requests.
b. Check for any rate-limiting errors in your nginx logs or any serialization/authentication errors your server might be throwing for the webhook call. These happen less often but can be a reason for breakage.
If the webhooks count is good but there are some missing for specific cases, identify a pattern in the forward calls for which webhooks are missing. That can help identify if the application triggering webhooks could be failing for cases matching that pattern.
If you still can’t identify why your webhooks are missing, contact the application owner.
Maximize the user experience by monitoring webhook callbacks
There are no two ways about it - failing to monitor webhook callbacks will expose you to several application errors that will cripple application performance. Simply follow the steps outlined in this article and you’ll boost your chances of delivering an application that provides a seamless user experience.
If you want a fast and secure way of detecting technical issues before they impact your business, then watch this demo on how DrDroid can do this for you.