

Mistakes to avoid in Observability
Learnings from startups on what common mistakes they made while setting up observability


The capabilities of observability tools to manage crisis situations have significantly improved over the past decade. Despite that, a lot of issues that could’ve been avoided, with good observability, end up in production.
From our experience, and inspired by inputs from experts like Stephen & Soumyadeep, in this article, we talk about some common mistakes in observability that can be avoided:
Common Mistakes in Observability
Not building context of your product:
1. Not tracking what the customer sees:
It’s easier to set up monitoring at a host level from the observability data but it doesn’t tell you the customer’s perspective. Set up metrics that give you insight into how the customer would be impacted.
For e.g., in my previous job, we created custom dashboards to monitor the API response time to our clients and the success rate for our supply-demand matching algorithm since they were a direct indicator of our end customers’ experience.
The flip side is, what if you track only what the customer sees? Continue reading to see how that could be problematic too.
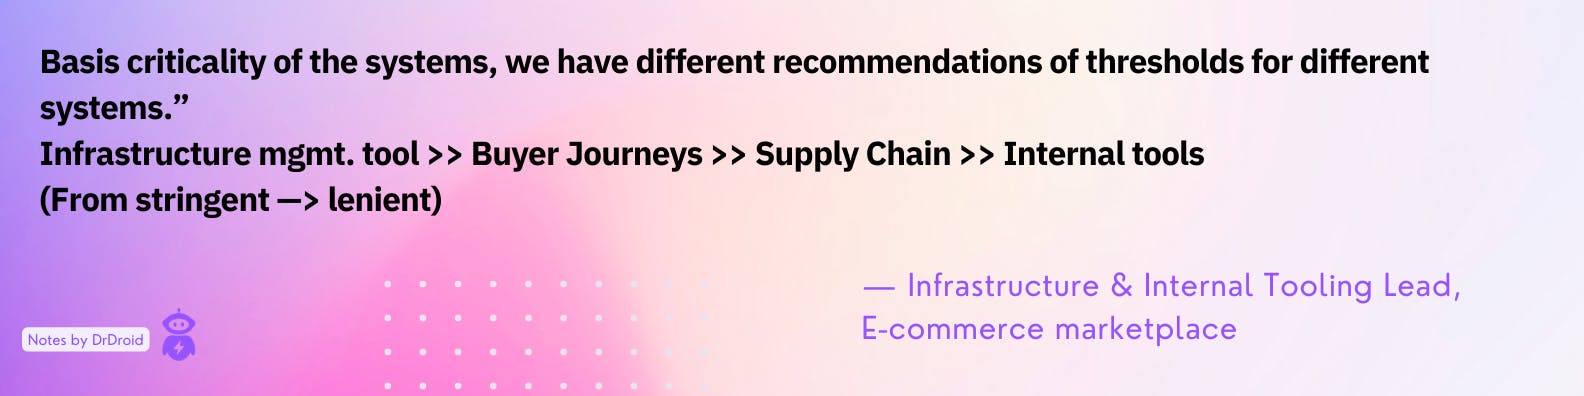
2. Following the same metric sampling rate and thresholds across services:
When setting up alerts, spend time identifying the sweet spot of metrics sampling rate and thresholds in them - these could vary based on your user’s requirement and use case. Business critical flows have stringent thresholds while internal tools could have relatively lenient thresholds.
Having a setup that is hard to investigate / triage:
1. Only tracking what the customer sees:
High-level metrics (e.g. response time) are useful to see the health but while investigating, your team will immediately feel the need to peek into more detailed metrics (e.g. CPU / memory / iops) so that finding the root cause is easier if any of the high-level metrics go bad.
Having deeper-second order dashboards alongside an overall health dashboard helps the team investigate faster.
2. Lack of instrumentation guidelines for new services:
When instrumentation is not done at the source or if it’s done differently for different parts of the code, it increases the difficulty of finding root-cause of misbehaviours: search queries become hard with inconsistent logs; monitoring becomes hard with high variance in metrics being tracked.
It is recommended to share common instructions with the team on how to instrument (logs, metrics and traces data) within any new service/component.
3. Not setting up tracing:
Do you follow a micro-services architecture with multiple components calling each other? Tracing enables you to follow a particular request within your code, and across services. Setup tracing (at least) on your most critical product flows. It will save you crucial triaging time, esp. in times of crucial SEV0 / P0 incidents.
4. Inaccessible or hard-to-find data
Limiting access to observability data & creating bottlenecks for access leads to data silos for engineers trying to understand the system as they are deeply interconnected. Democratic access to observability data empowers teams to triage faster and without the need for assistance.
5. Adopting tools without alignment / Using too many tools:
Data scattered across multiple dashboards (e.g. logs across server files, CloudWatch & Kibana) create an artificial need for context switch and slows the investigation process. Additionally, mandating tools without alignment of engineers (users) can lead to poor adoption and hence, difficulty in investigations.
Creating Fatigue and not actionable insights:
1. Too many dashboards create too much noise
Your service is a small portion of the overall product architecture. Standalone dashboards for each service can be avoided if they intertwine closely/cascade with another service. Combining dashboards for critical flows makes it easier to find data and give a holistic picture of the situation.
2. Only having time-series graph-based dashboards
Not every metric is a graph. For some things that are as direct as error rate or the number of live pods, keep numerical counters in your dashboards as well. That will make them easy to find and absorb for quick action.
3. Too many alerts
While you would want to know about everything that is going wrong with your system, only set up alerts with thresholds that you are ready to wake up at 3 AM for. For everything else, rely on dashboards alone as they are not critical for your customer.
Cultural Gaps:
1. Positioning observability as tool to use during issues and incidents only
Apart from incident triaging, observability is an important mechanism to help teams understand how their systems are behaving. It helps understand the performance of different requests, APIs and errors - which provides an opportunity to improve the quality of applications.
Without this, teams are collecting tech debt that will be too expensive to pay later. Read more on how to promote observability in your team here.
2. Having a single point of failure for the observability tool
Even if your team becomes trained at using the tool and has adopted it well, you should share knowledge on the set-up process and how to create dashboards/alerts. That not only will give your team a deeper perspective of how the tool works, it will remove dependency from individual developers.
Observability can become your most powerful weapon in driving data-first culture in your engineering team. Read more about this here.
Was there any other mistake that your team corrected over the last few years in your observability journey? Share them in the comments below and help others avoid them!