How to do post-deployment monitoring with Doctor Droid?
This guide explains the process of setting up post-deployment monitoring using Doctor Droid
Before starting, ensure that you have setup Doctor Droid Playbooks with at least one playbook and a Slack or MST integration. Check out these tutorials on how to get this done.
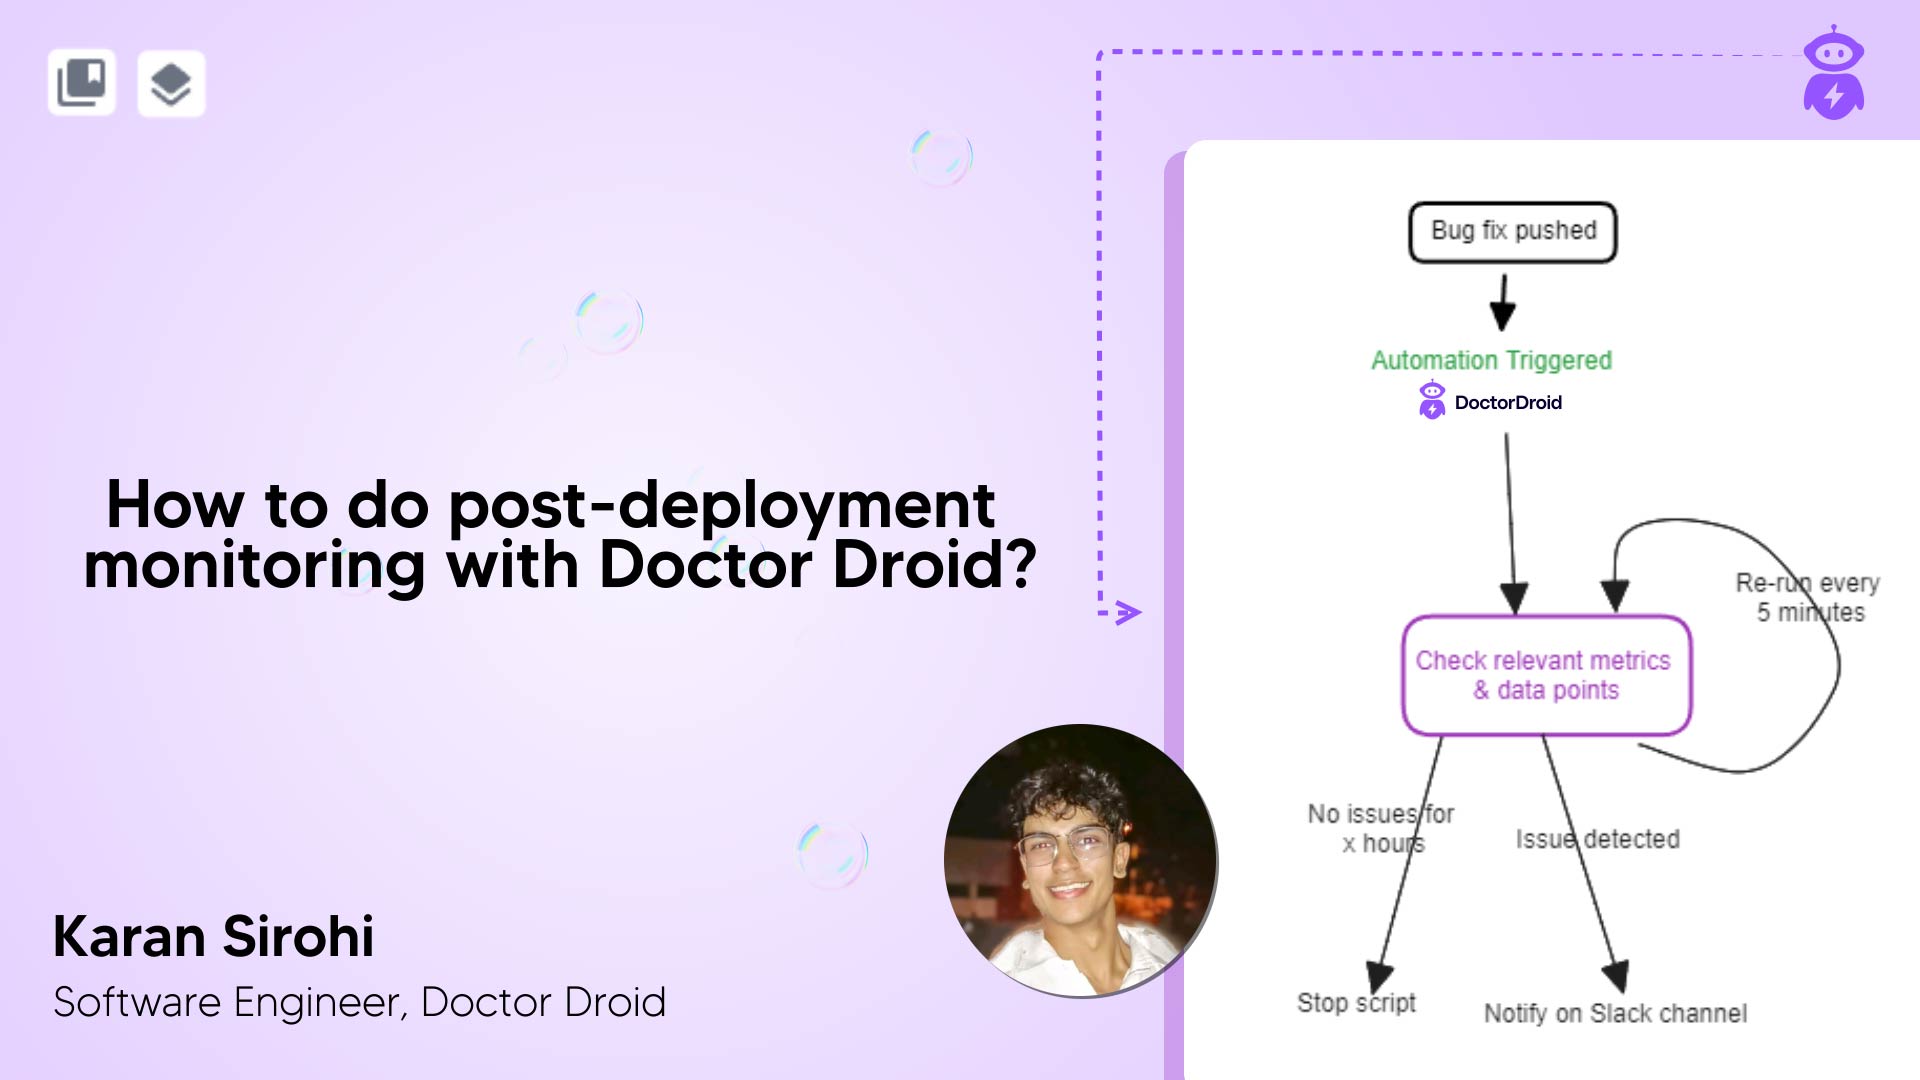
Consider a scenario where a critical deployment is planned. As a developer, you would want to track a set of logs and metrics continuously after the deployment.
In large-scale deployments, monitoring is crucial. Tight thresholds and noisy services often lead to frequent alerts. If something breaks, the process starts over, monitoring everything again with tight thresholds. This can be a hassle. To simplify this, set up a post-environment monitoring workflow.
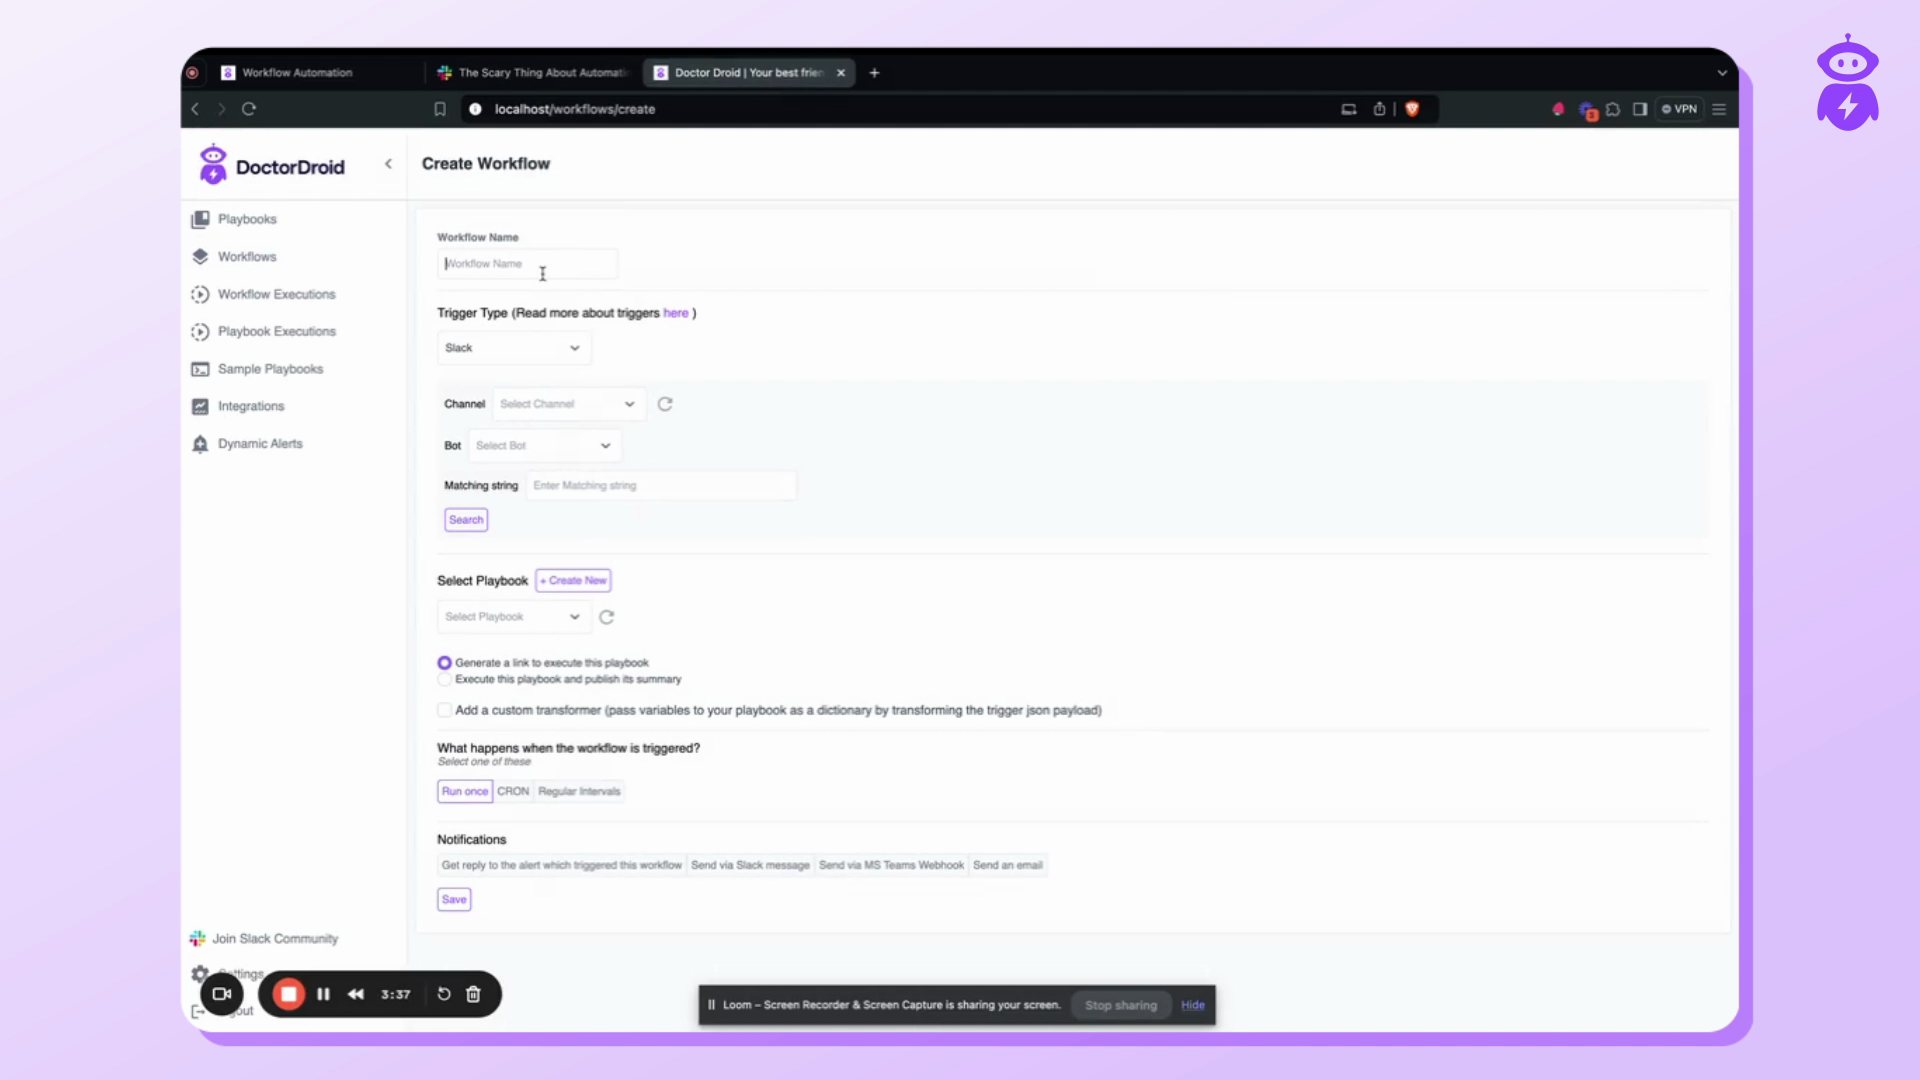
Setup a workflow
Step 1: Navigate to the Doctor Droid Playbooks platform and create a new workflow for this purpose.
Step 2: Select a trigger with the API trigger and choose a playbook which includes tasks for querying logs & metrics that you would want to track post the deployment.
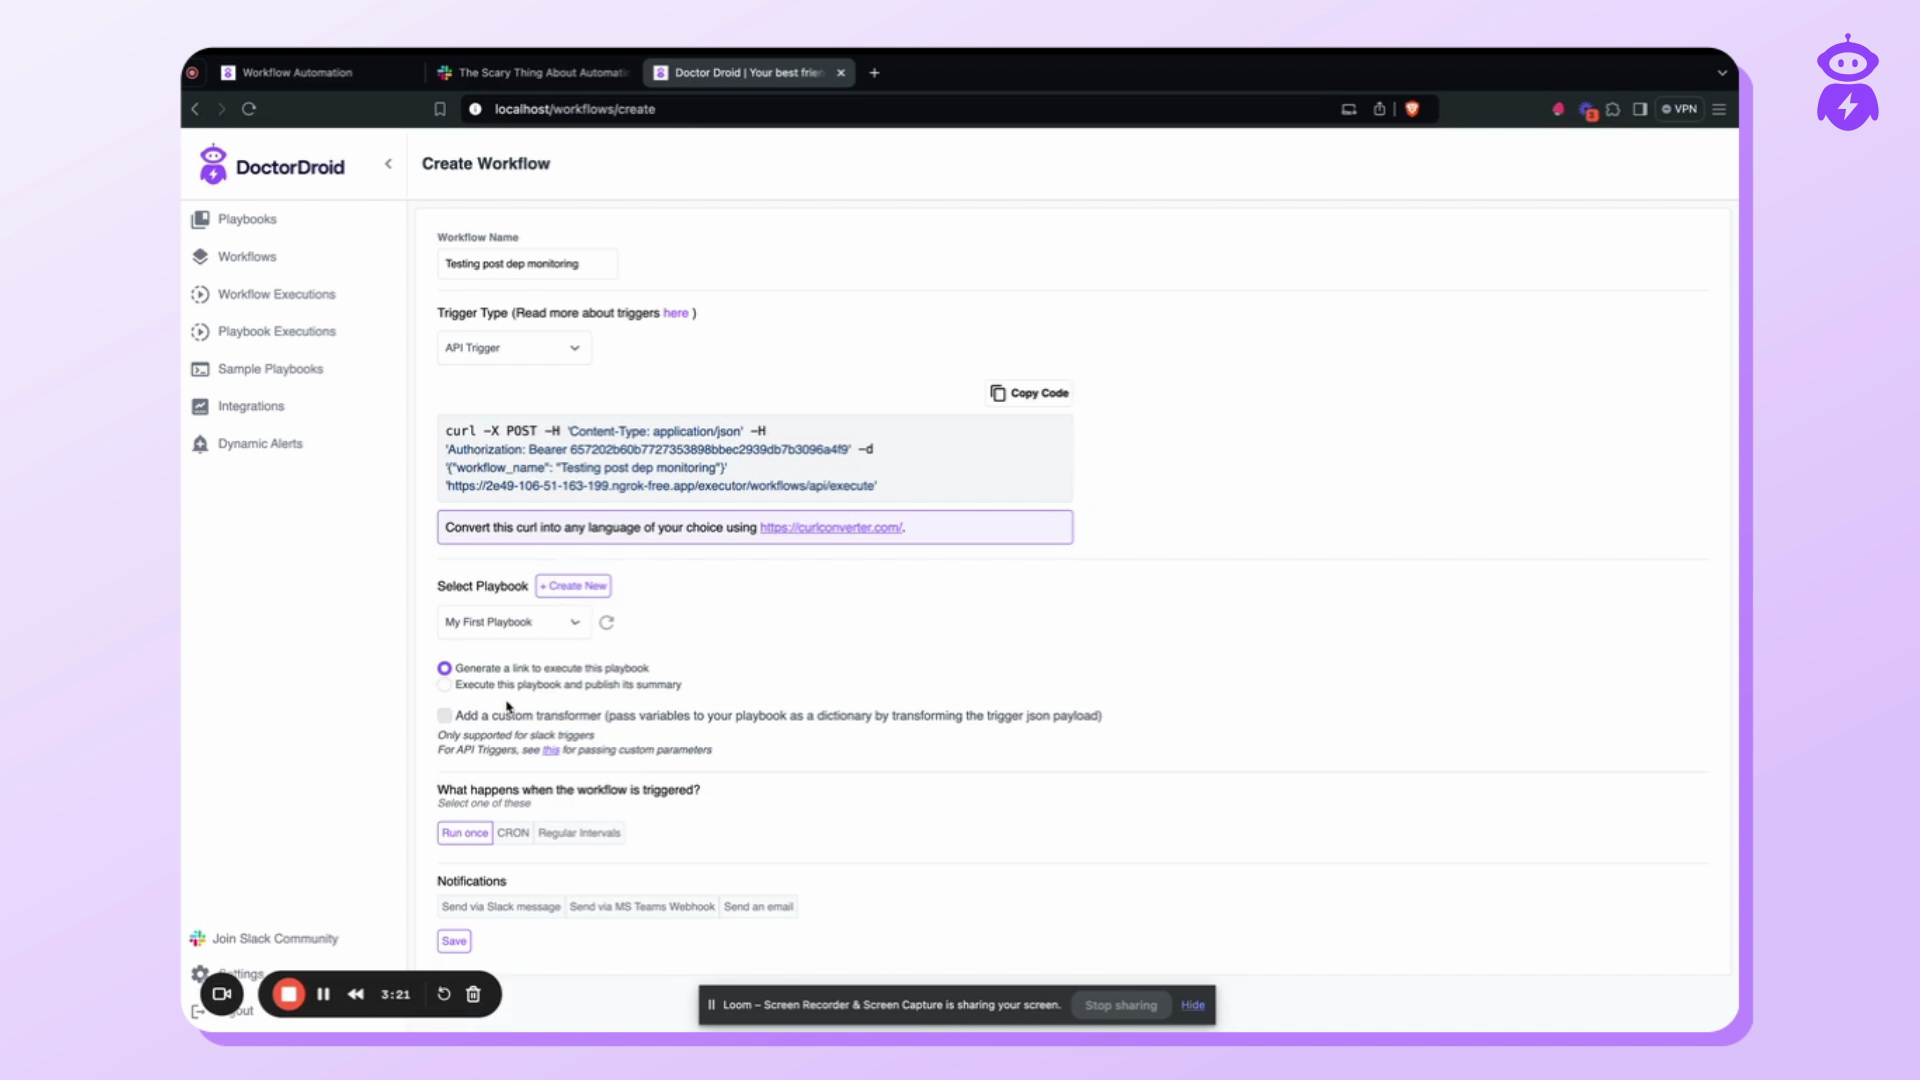
Step 3: Execute this playbook and publish its summary in Slack.
Step 4: Select the appropriate channel and set up a cron schedule. For instance, set it to run every minute.
Step 5: Save the cron schedule and save the workflow
Test the workflow
Step 1: Copy the API trigger code and run from terminal. You'll receive a workflow execution ID.
Step 2: Observe the successful workflow execution with the provided ID.
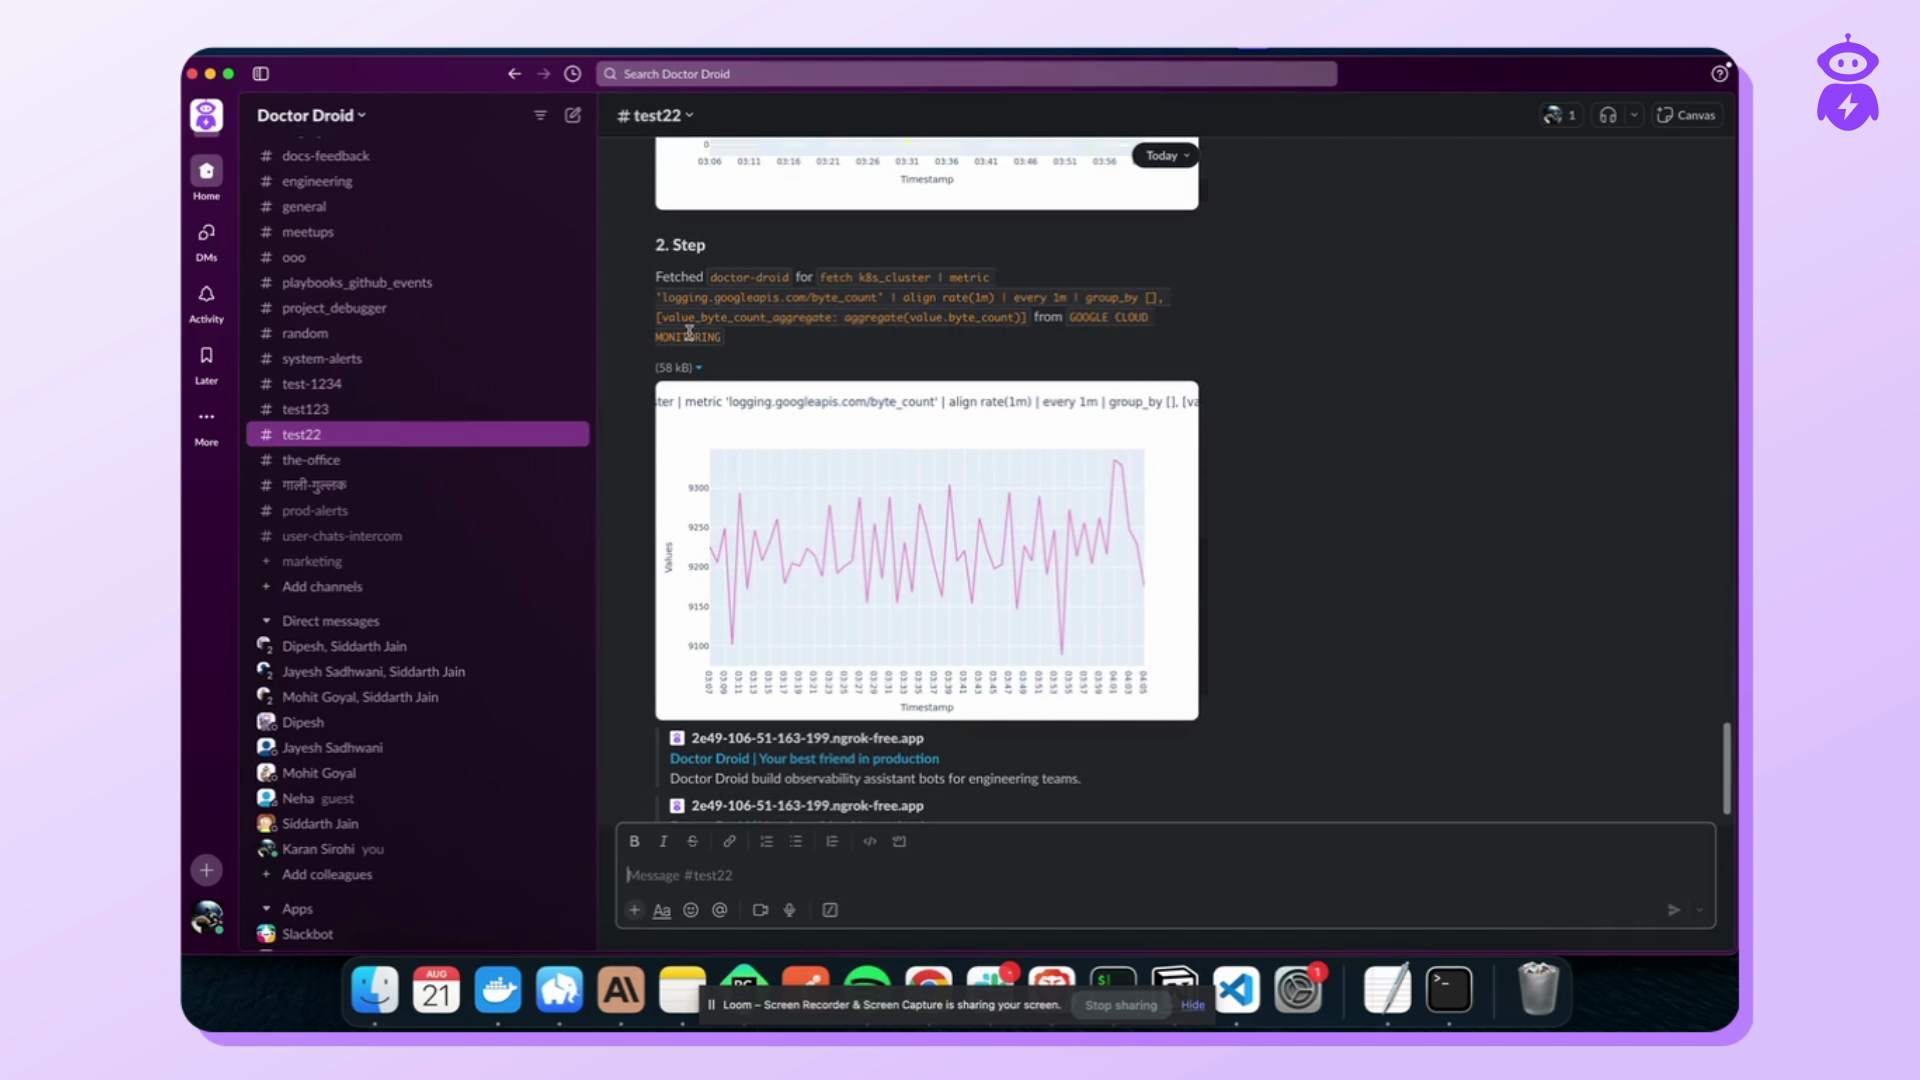
Step 3: Once the workflow executes, the output of the metrics and logs from the playbook configured in it.