

Observability of APIs in Production Environment
Framework for observing, debugging/investigating and remediating APIs
D
Software Developer | Debugger
Search for a command to run...
Framework for observing, debugging/investigating and remediating APIs
Software Developer | Debugger
No comments yet. Be the first to comment.
This series will focus on articles to help developers achieve industry standard observability for their cloud based software systems that will allow them to reduce MTTR.
Understand the meaning of observability, monitoring, instrumentation and more!
An AI agent operating on production systems is only as effective as the context it can access at the moment a question is asked. Generic foundation models, however capable, do not know your service na

Your code lives in your IDE. The context you need to debug it lives everywhere else. That gap is the whole problem. So recently we found the solution for it. DrDroid now has an MCP server, and it puts
An explainer on how a specialised debugging agent like DrDroid helps engineering teams accelerate operations

Here's how DrDroid's Investigation Agent is specifically engineered for incident response, alert investigation, and infrastructure troubleshooting
When engineers first hear about DrDroid, the most common question is: "What will my team actually USE this for?" If you're on-call for production, here's exactly how DrDroid helps: from firefighting incidents at 2 AM to automating your most repetitive runbooks.
If you’re someone who understands instrumentation well, feel free to jump directly to the symptoms and investigation section directly.
Software is eating the world. Adoption of API-first approach has been one of the key drivers for this fast paced software development.
APIs are the communication pathways through which programs talk to each other. They have become a powerful tool for abstracting the underlying implementations of a software and just expose what is needed for the caller to interact with.

APIs come with certain promises, like repeatability of request/response structures (Contracts), predictable speed of receiving the response (SLAs) and logical outcomes (Status codes). Here are the 4 expectations from the API:
Predictable & Fast Latency
APIs are written for specific purpose and hence, that purpose must be fulfilled in a predictable time period. The faster and more predictable your APIs are, the better the experience of the caller.
No Errors & logical status codes
Runtime exceptions will cause your code to exit and throw 5xx errors to the client, which will have to be overridden using custom middleware. In cases where an exception occurs, clear reasoning on the error and the status code must be put in place.
Scalability
The performance and behaviour of the API should not change based on how much traffic it takes. There can be upper limits of how much traffic you can handle that you tell your clients/users, but it should behave similarly when below those limits.
Consistent contracts
Abstraction means that the caller wouldn’t be able to know if the structure or the code of the API has been changed. Any change to the API payload, response or code need to be updated to the caller explicitly.
Why are we talking specifically about production
Adding a debugger in the compiler or running unit tests typically enable you to evaluate and test functionality of the APIs in staging environment. But it doesn’t replicate the complexities & challenges of the production environment.
To identify if our API is performing well, we need to observe our API's behaviour in production. This is doable by instrumenting our service code which has this API and view its metrics & traces. If you are new to instrumentation, read more about it here.
Logs
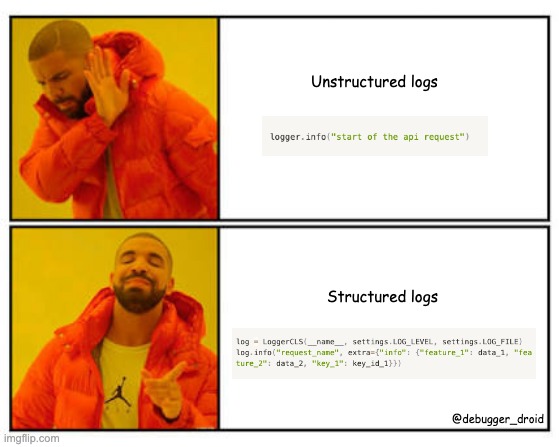
You can log statements and pass them to your logging framework to be available for querying later. You can put smart logs to tell the stage of the code your API request has reached and what the value of the variables are. This can help you gain a lot of insights. Adding unique identifier in the logs will help you search them better (more relevant if you do not have tracing implemented).
Errors
If you are checking logs for runtime exceptions in an API, Sentry, GlitchTip or equivalent will save you time - it pin points the error reasons and stack traces! (Both are open source)
Metrics
A quick health check of any API can be done by having a quick scan of historical time-series based metrics analysis of the following data points:
Traffic / Request count (in requests / minute)
Latency (in milliseconds)
Error rate (% error)
Traces
Traces enable you to see step-wise details of your code during execution. For example, clicking on the DB call within the steps will tell you which query ran and what is its average behaviour as a metric.
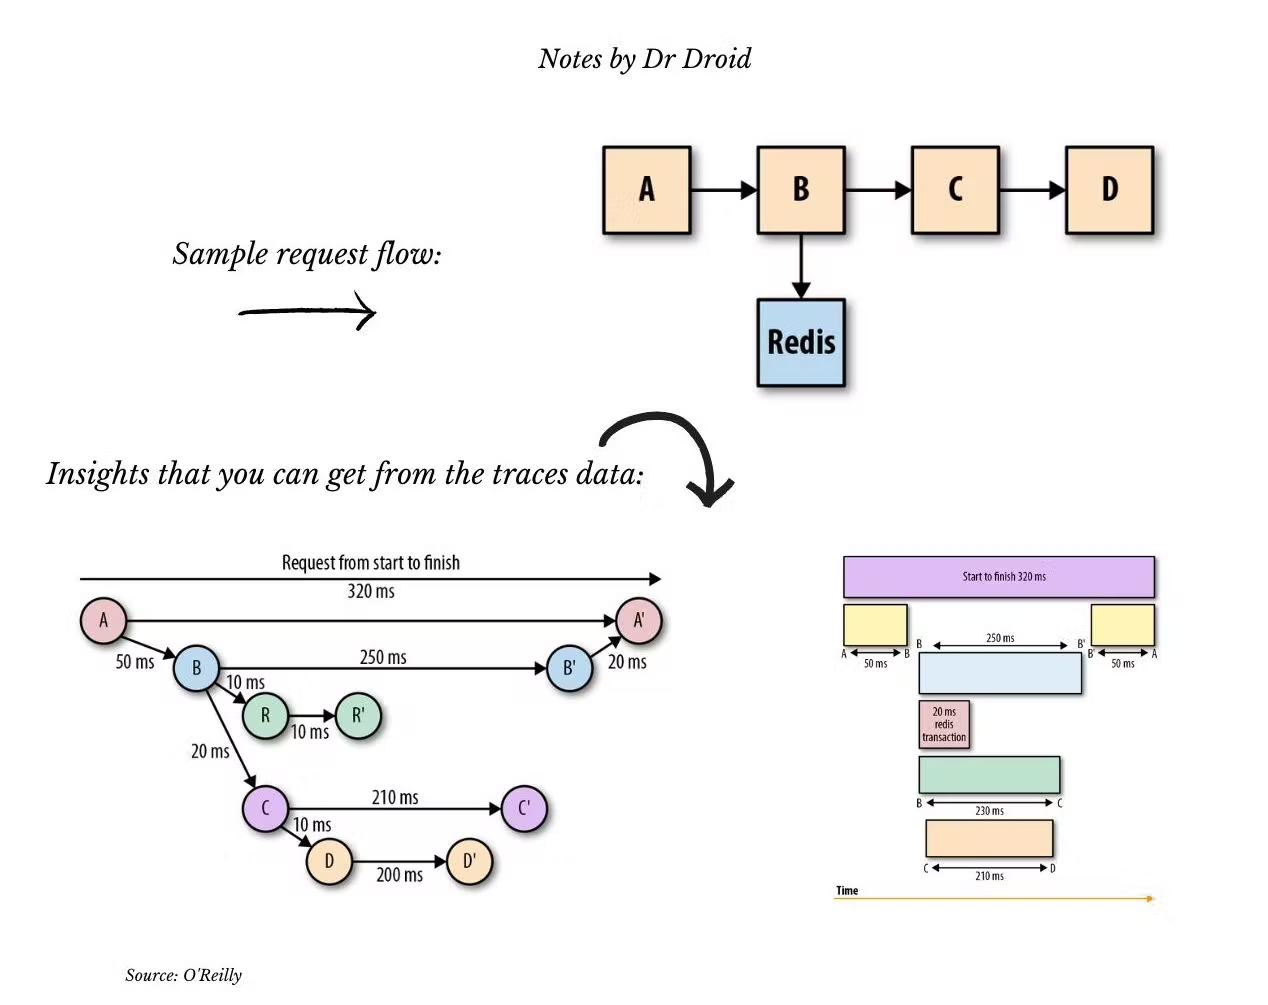
Metrics and traces can be setup using commercial tools or open source alternatives (Prometheus / Jaeger). More details on this to be released on a blog shortly.
The telemetry data mentioned above, still needs to be made available at a UI that is accessible to the user. The following are the two essentials that need to be setup here:
Grouping of metrics: Group metrics at an API or at a service or a product workflow level depending on the criticality of the API. If it’s a business critical API (e.g. payment or login), create a unique dashboard but if not, it can be a part of the service dashboard.
Accessibility: Add links to relevant dashboards in your troubleshooting playbooks and give democratic access to all dashboards to your users.
In most cases, you might end up with a scenario where your API is not performing right. It could be because of multiple reasons.
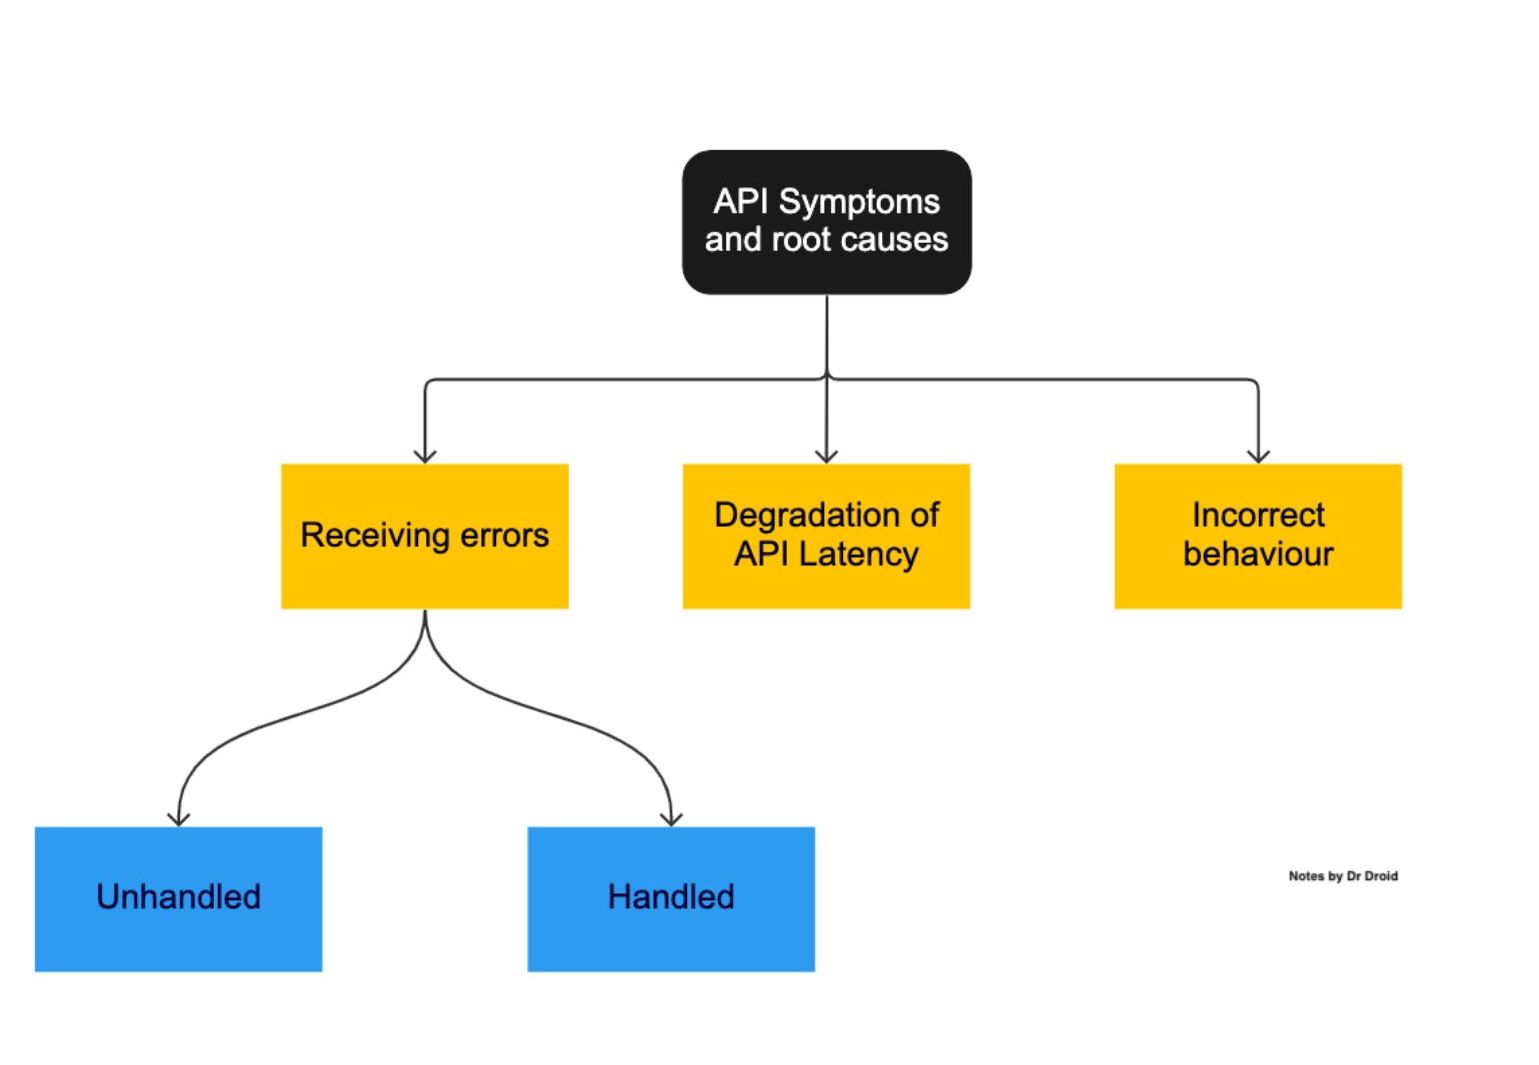
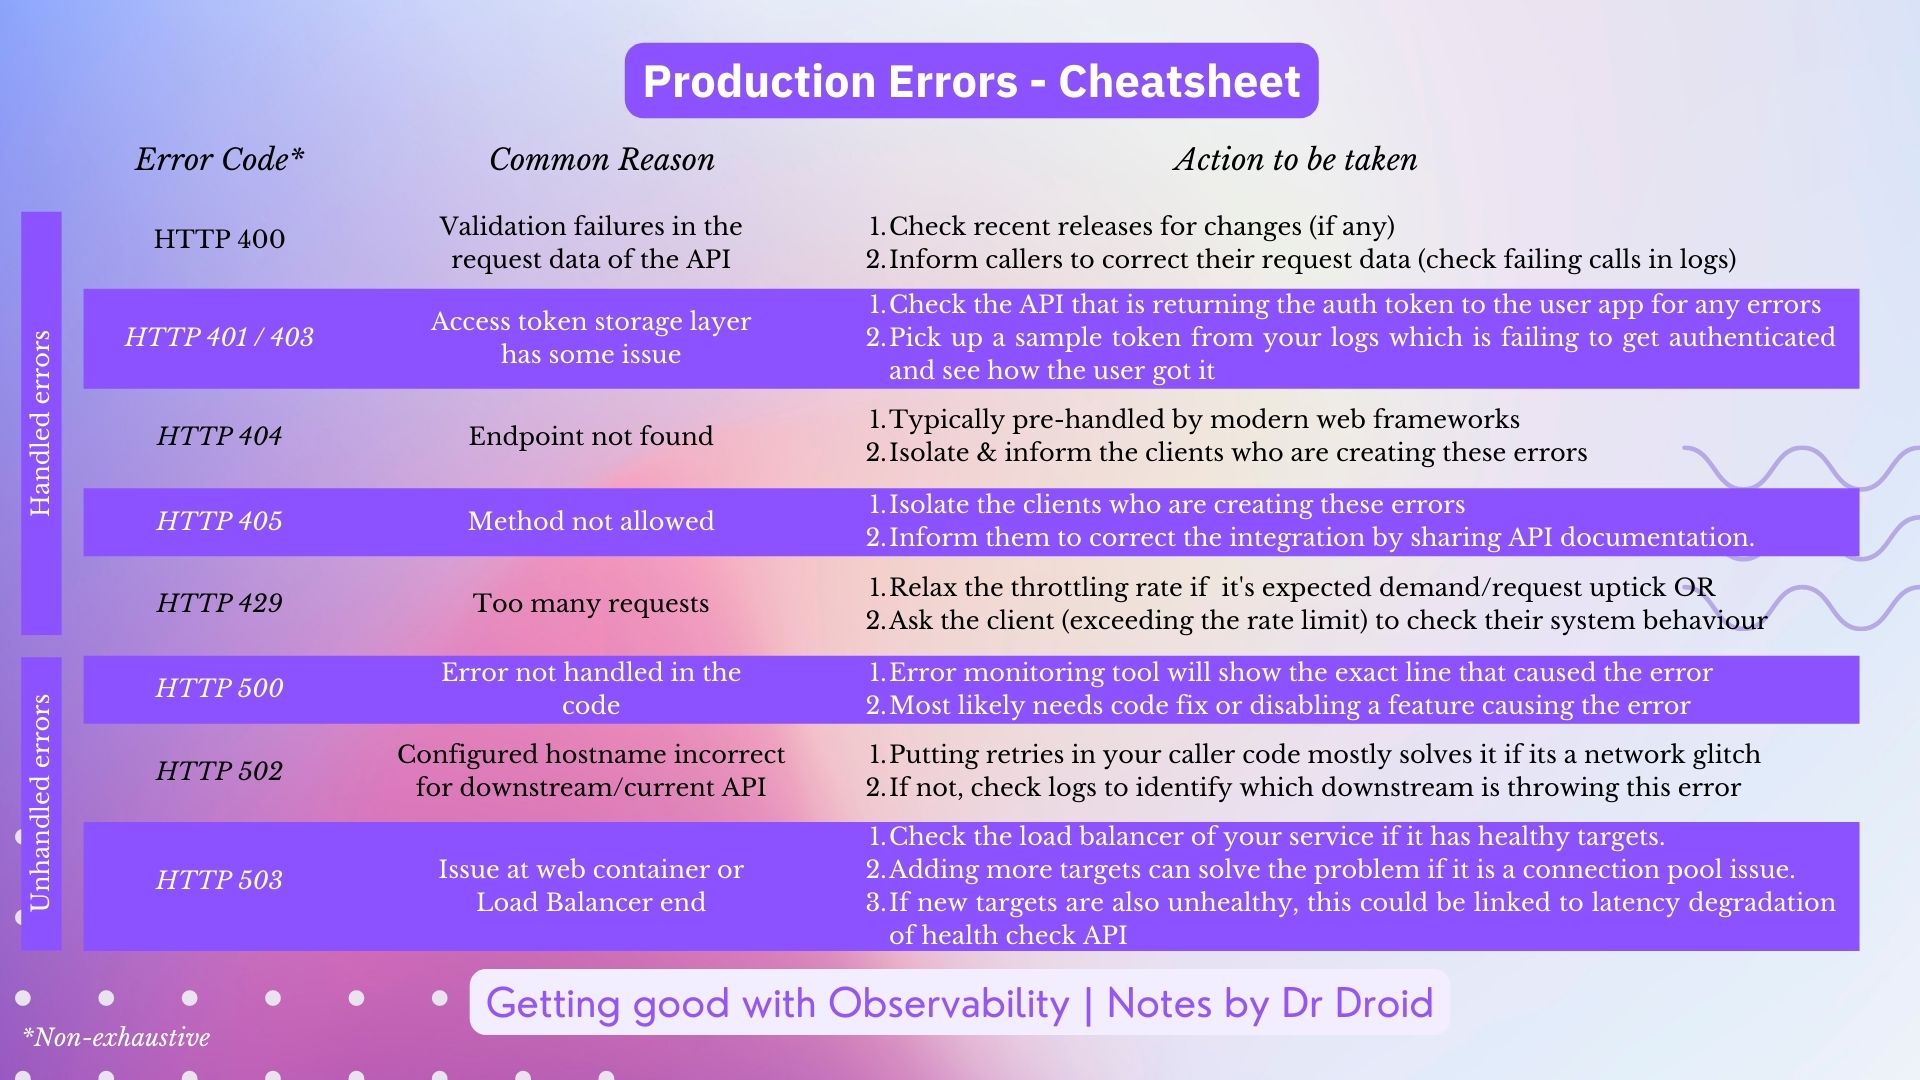
API errors can largely be classified into two categories: handled or unhandled.
Handled Errors
HTTP 400: For validation failures in the request data of the API, you return a 400 error. If that happens a lot, that would mean either the callers are sending wrong data too frequently or you have added some validations which are failing correct requests. How to fix: You should check the Pull Requests for recent releases in that service to find that changed validation or if you have added logs for validation failure cases, identify which callers are failing the most and inform them to correct their request data.
HTTP 401 / 403: Failure of proper authentication or authorisation results in 401 and 403 errors. If they happen too many times, that would mean your authentication token generation is happening improperly or the token checking process is failing. Most often the case is that the access token storage layer has some issue. How to fix: Check the API that is returning the auth token to the user app for any errors from your monitoring tools. If that doesn’t work, pick up a sample token from your logs which is failing to get authenticated and see how the user got it (if your company policy allows it).
HTTP 404 / 405: In case the endpoint the client is hitting on your service isn't exposed, you throw the 404 code. In case the endpoint is present but the HTTP verb used in the call isn't supported, you throw 405. These are mostly handled by all modern web frameworks themselves. Any presence of these shows incorrectly integrated client. How to fix: Isolate the clients who are creating these errors from your error monitoring tool and inform them to correct the integration by sharing your correct documentation for the API.
HTTP 429: In rare scenarios, your clients may be exceeding the rate limits you have set on the APIs and that throttling is kicking in. This would return HTTP status code 429 to them for each extra hit. This is a practice you follow to protect your servers from being hogged by a few clients. How to fix: Ideally, in such cases you should either relax the throttling at your end if your business requires it (as long as your system can handle that load) or you ask your client to check at their if they are making so many requests.
Unhandled Errors
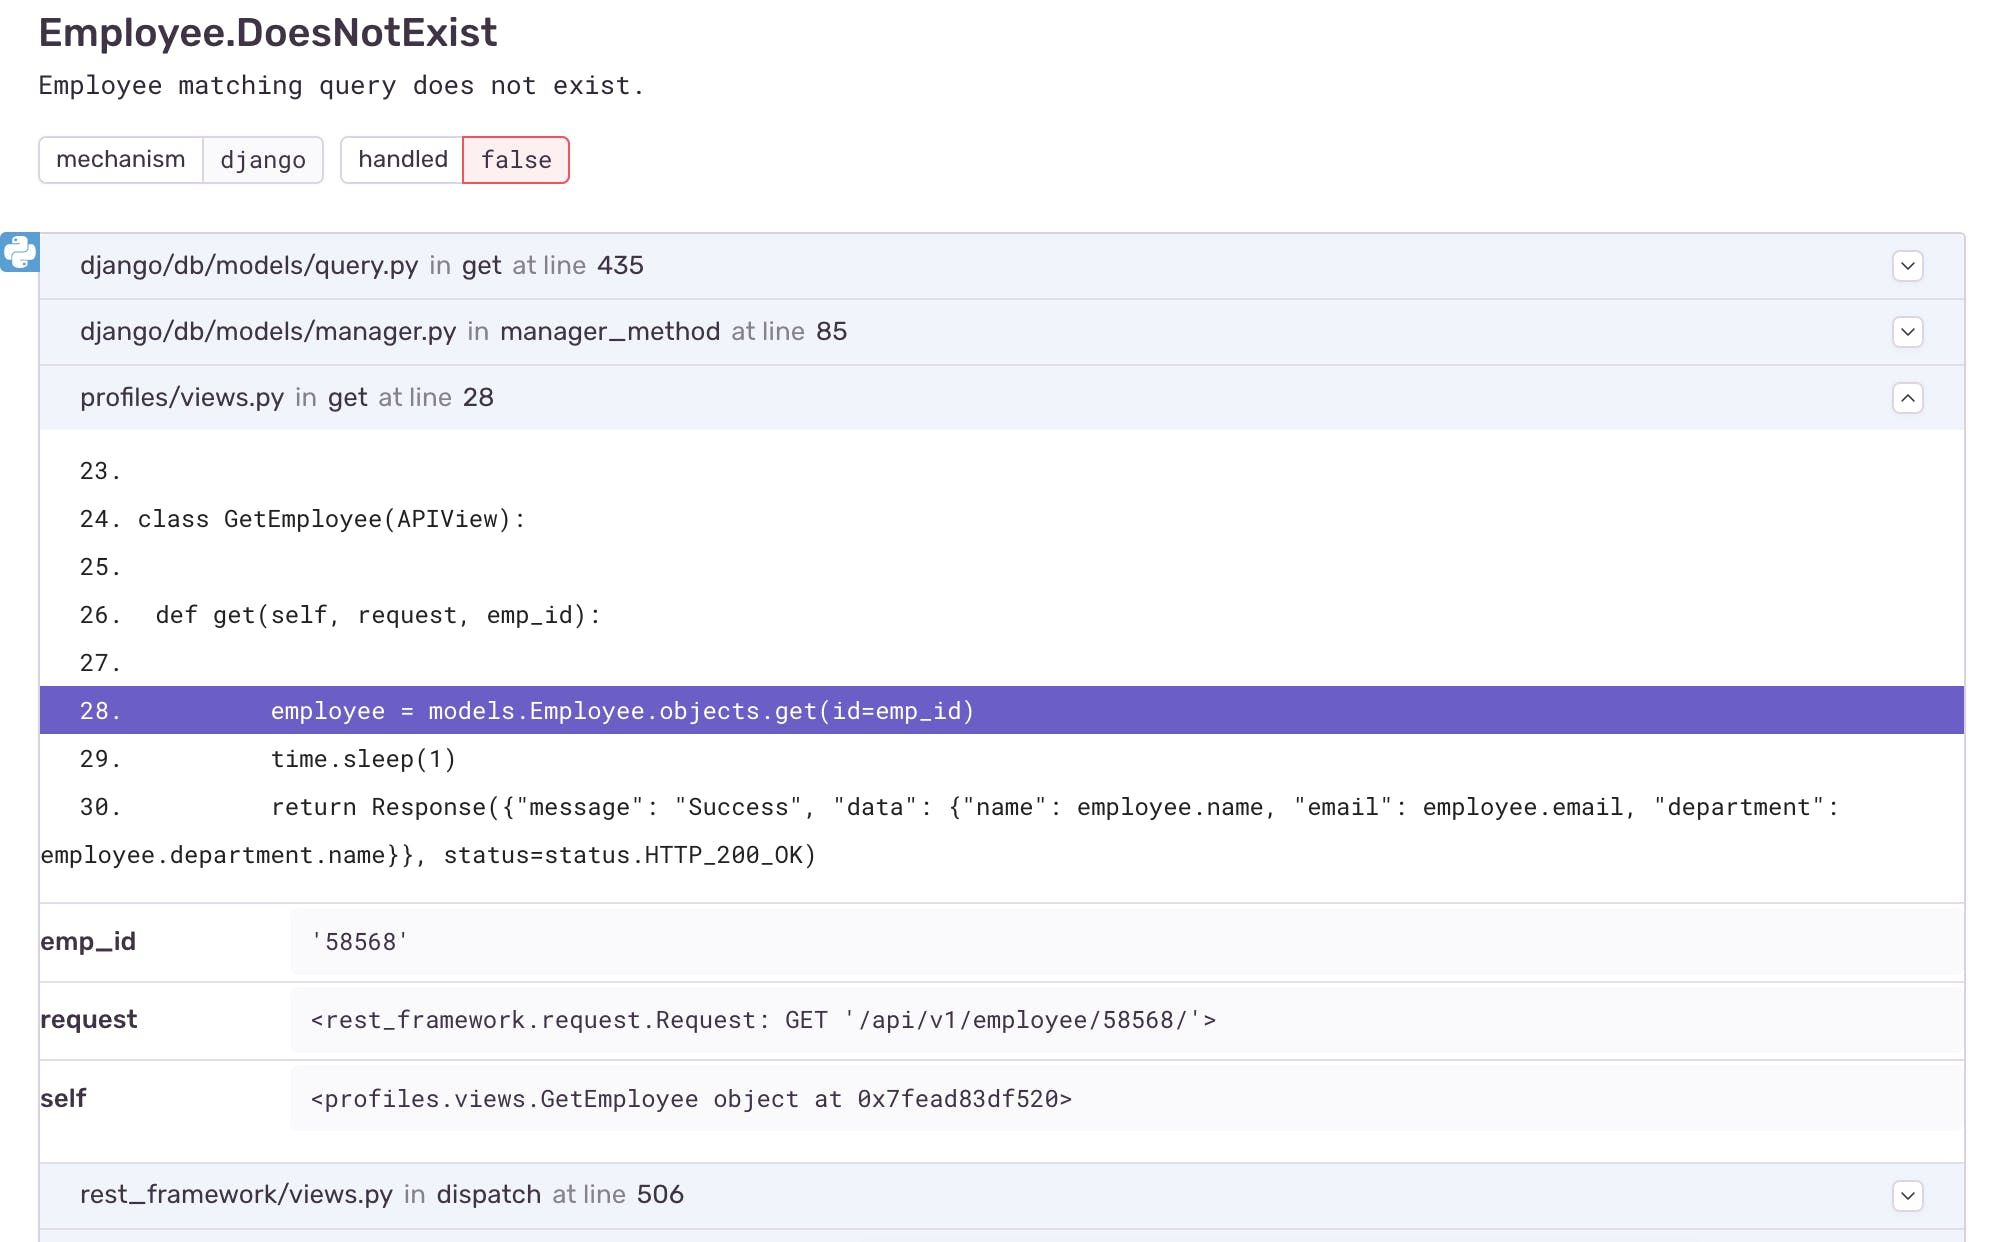
HTTP 500: When an error happens in your code that you haven't handled, the web framework will mostly throw 500 error. That indicates that your code and the variables it is handling ended up in a state that your code couldn’t handle like a NullPointerException. These unhandled errors can be seen on your error monitoring tools. How to fix: From your error monitoring tool or from your logs, you will know which line of code is causing the error. This could have been introduced either due to a new release or some new data flowing in which wasn’t earlier. Most likely you’ll need to make a code fix or disable some feature that caused it to break.
HTTP 502: If your API is returning 502 errors, that would mean some server is unreachable due to their DNS resolution failing. That happens if your configured hostname is incorrect for a downstream API call or that hostname is incorrect. How to fix: Putting retries in your caller code mostly solves it if its a network glitch, but don't put too many re-tries because in case the hostname is genuinely unavailable, it could cause trouble with your processing queues. You should put logs so that you can identify right away which downstream server in your API context is throwing this error. More on this here.
HTTP 503: 503 errors happen when your service is unavailable to take on requests. This can happen due to the web container unable to connect with the application server or if your LB doesn't have any healthy targets to serve the requests. How to fix: Check in the load balancer of your service if it has healthy targets to send requests to. Most likely this happens because health checks are failing to the targets due to them being too slow or having run out of available connections. Adding more targets can solve the problem if it is a connection pool issue but if your new targets are also going unhealthy, this could be linked to latency degradation of health check API.
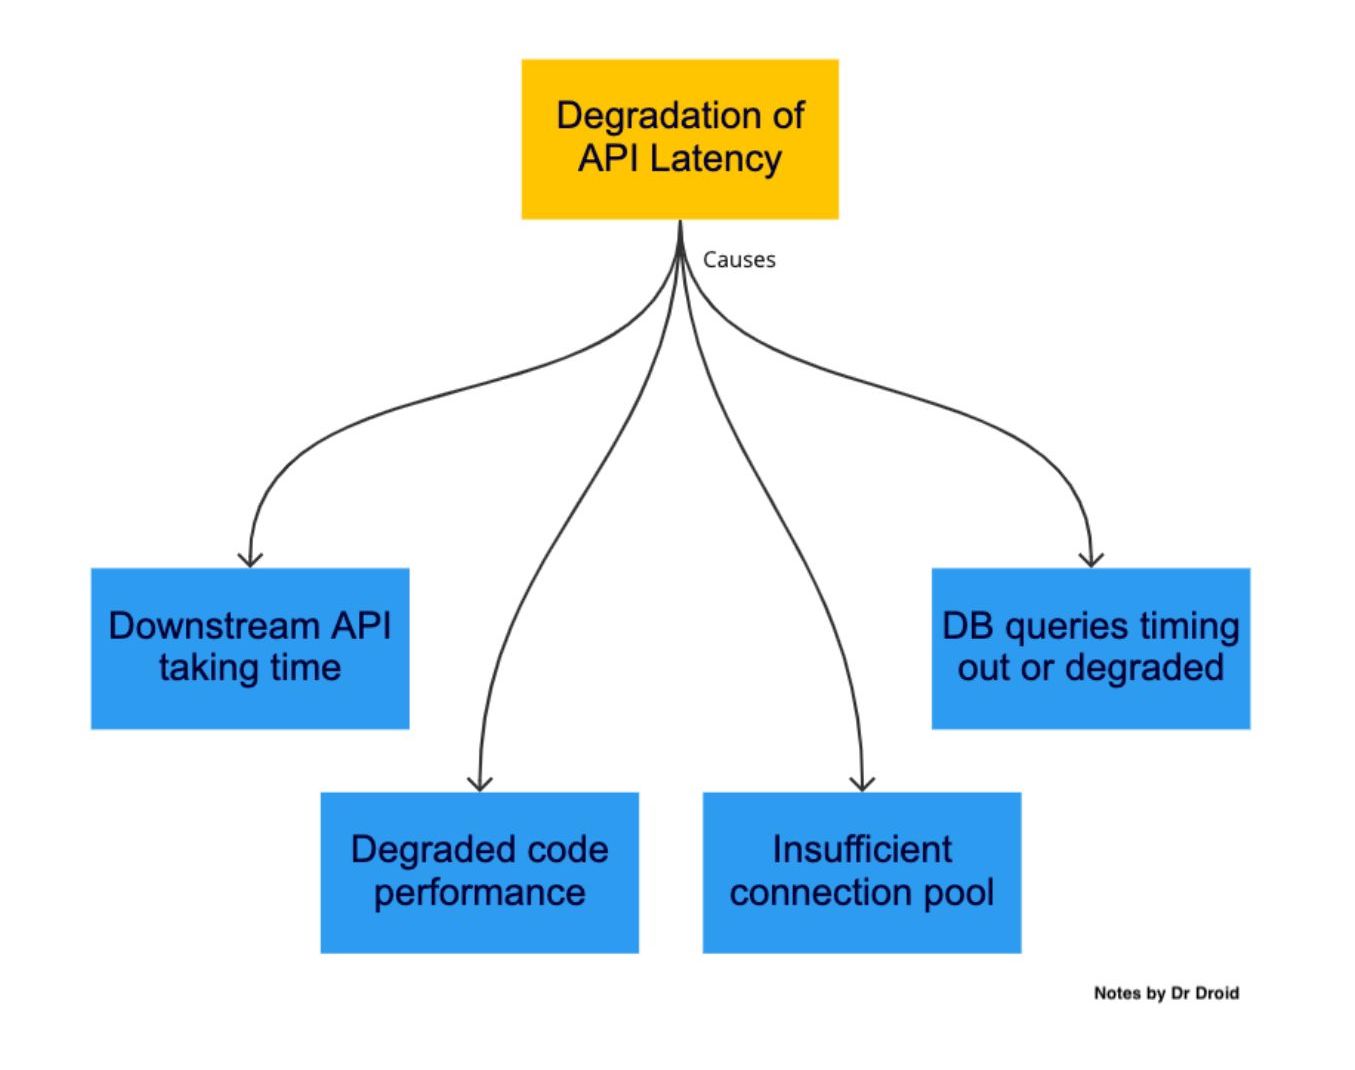
Response time increasing is a pain point that comes with increasing scale or poorly written code. Either way, the best place to know this is in the traces. For an API, the time is took to respond can be deconstructed into smaller steps it had to execute. They are called spans. By looking at them, you can find the slow moving parts.
Typical reasons for API slowness:
a. DB queries are taking time
DB call spans will tell you time it took to connect to your DB and querying it. Compare them with the DB span from the period when the API was working fine. Slowness in these spans could be caused by:
i) New code changes with inefficient queries (not using the correct index when selecting a large data set or fetching too big datasets). How to fix: The fastest way to fix this will be disabling the feature which causes that query or rolling back your changes. In case neither is possible, then quick remediation could be done by introducing new indexes in real-time, although that is highly discouraged.
ii) DB is under stress and queries are taking time (this can be confirmed by checking if all queries to the same DB are taking longer than before or not).
How to fix: This could be due to a crunch of different type of resources in the DB. A detailed note on this will be published soon.
iii) In relational DBs, concerned table could be locked. In case your are writing into a particular table and it is locked by some other thread, you query could be slow and eventually time out based on your DB setup. How to fix: Database running queries need to be check. Different DBs have different way to store and query this data. Here is how you find it in MySQL and Postgresql. The session which is running the locking query must be killed. These steps mostly likely can only be performed by your Devops or DBA team.
b. External API call is taking time
If your API is making a call synchronously to some other API, your slowness could be due to that. This could be a call to Redis or a broker or some other internal/external API.
How to fix: As a caller of APIs from anywhere in your code, always setup timeouts to protect your own customer's experience. Should also look at implementing circuit breakers if you are dependent on too many such downstream APIs and you can afford them not being available in your product temporarily. In any case, reach out to the owner of that API immediately if you can’t rectify it.
c. Code execution is taking time
This happens due to your service running on under-provisioned infrastructure. You can identify this by checking code spans in the request trace. They can be identified by names starting with 'Function' or your programming language.
i) CPU - If a server is taking more requests than it can handle in terms of CPU cycles, it starts becoming slower overall as processes fight with each other for processing power. How to fix: Robust auto scaling based on CPU must be setup on your service hosts to make sure no host goes over the tipping point w.r.t request traffic. Make sure your host doesn’t allow more traffic than what it can handle by fine-tuning the number of connections it can take in.
ii) Memory - If the processes running on the host are utilising the memory but aren't releasing it, that would make the memory unavailable for other processes to use. Although most modern languages do auto garbage collection for freeing up memory, poorly written code can still cause it.
How to fix: Quick remediation for memory issues on hosts is restarting your application process on it, but for long term code changes might be needed to remove the erroneous code. Make sure you use the latest stable version for all third party libraries as they would have been tested well for memory leaks by the authors and the community.
d. Insufficient connection pool
Your web containers could be finding it difficult to get connections to your application layer due to exhaustion of the connection pool. This happens when your hosts have maxed on the number of connections per host and also on the number of hosts. This could be happening due to poor configuration even though you can handle more load.
How to fix: This also can be solved using auto scaling on your hosts and auto scaling of workers on your hosts up to the limit each can handle. Quick remediation would be addition of more hosts.
Another issue that you might face is that the API is within expected latency, has normal error rate but is not responding as per expectation.
This usually means some logical change has gone inside the system that has broken the API. Some obvious reasons could be:
a) For read-only APIs, it could be due to underlying data being corrupted or missing.
How to fix: Check what process inserts/updates that data in the storage. Putting logs in both the insertion and the read API can tell which part isn’t working right. If you don’t have logs, try and make the API call for reading data which exists and should have been returned. The result of this test can help you isolate the problem.
b) Some feature flag could have caused misbehaviour in the APIs. Lack of proper testing can leave bugs in the new feature or unintended consequences in existing product flows.
How to fix: Should ****look to disable the feature or rollback the release entirely to remediate quickly.
c) Although unlikely, it could be caused by bad data coming in from your API caller due to an issue at their end but is not causing any exception.
How to fix: There should be good validations set up on request data and any anomalies in it must be notified to the caller through 4xx status codes or logged for being noticed.
A very useful way to identify root cause for incorrect API behaviour is to compare the current API traces with the past. You should be able to see some differences in the spans and their latency and can tell you what code flow isn't being taken anymore or is being taken now and that can help you find a pattern of the change that is happening underneath.
Investigation Strategy
As you start investigating, what do you check first and what next? Here’s the mental model that I follow to resolve any issue related to an API latency.
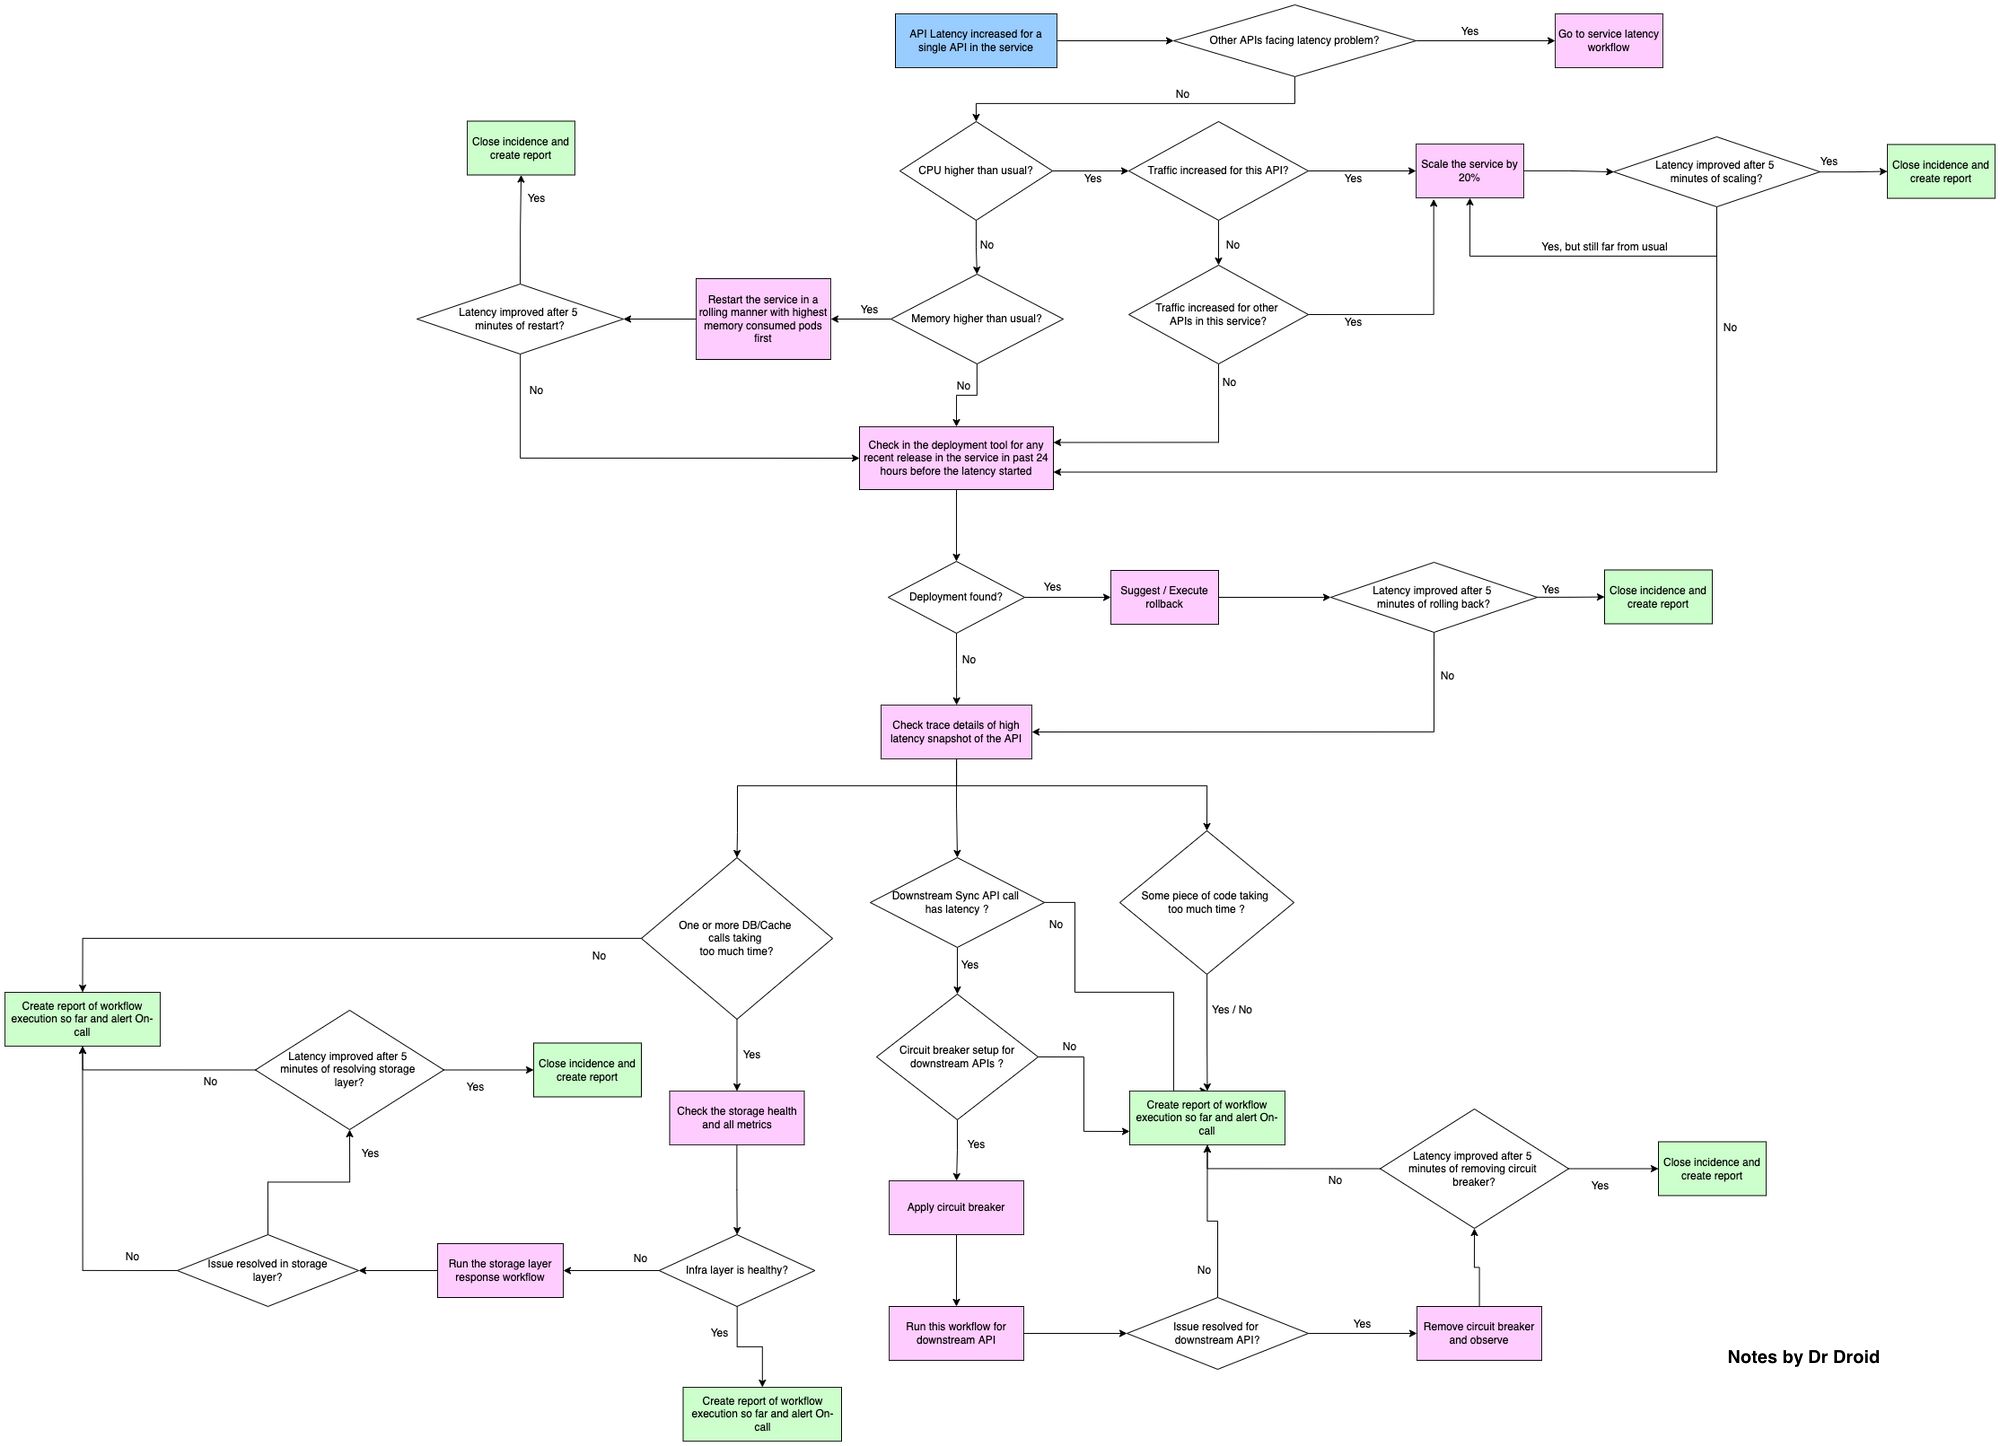
How do you debug an API? Tell us about your debugging strategies in the comments below!
If you’re looking for a tool to get better visibility on your APIs, application, integrations and errors, check out Hyperlook — it’s a error tracking and alerting platform for next-gen of software developers.