

What are custom metrics & How to track them with Doctor Droid?
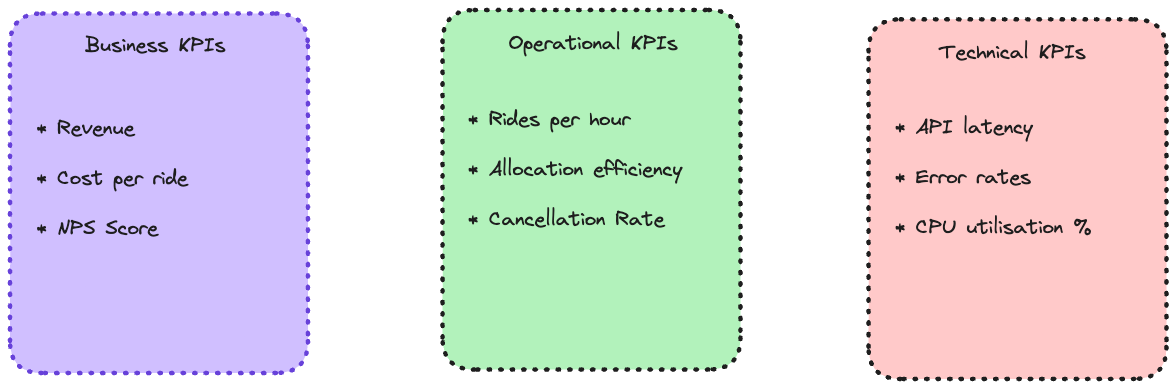
Custom metrics are a lens through which engineers see the product & customer experience.

Golden signals & APMs
Installing an observability tool like Datadog or NewRelic gets you access to API & Infrastructure metrics like golden signals, out of the box.
These metrics are useful to track the health of a specific service but lack context about the product or business goals that your API is helping achieve.
Leading indicators of application health
To combat this challenge, engineers often add contextual metrics & logs in the code, which help in the early detection of anomalies. Typically, these are leading indicators of the product & business KPIs from an engineering standpoint.
In a food delivery business like Doordash, order cancellation percentage or average allocation time, are metrics that are related to the company’s end-goals and at the same time, driven by engineering teams.
Types of custom metrics:
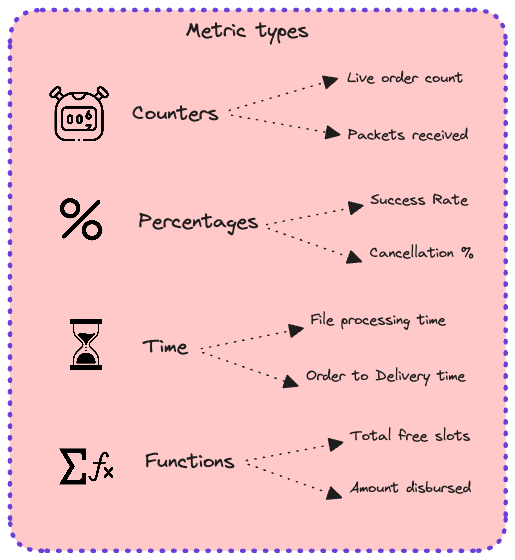
Multiple types of custom metrics could be relevant to your business:
Counters: These could be numbers like “Live order count” or “Transactions in progress” that you would want to track and compare against the past or targets.
Percentage values: These would be metrics like “Success rates” or “cancellation percentage” of a certain transaction that you want to track
Time Taken: These could be like a “delivery time” or a “processing time”, which represents the time between two critical checkpoints in your application
Sums / aggregate functions: These could be derivative metrics like “Earnings in last 30 minutes” or “average free partners available during dinner time”
Adding labels to these metrics:
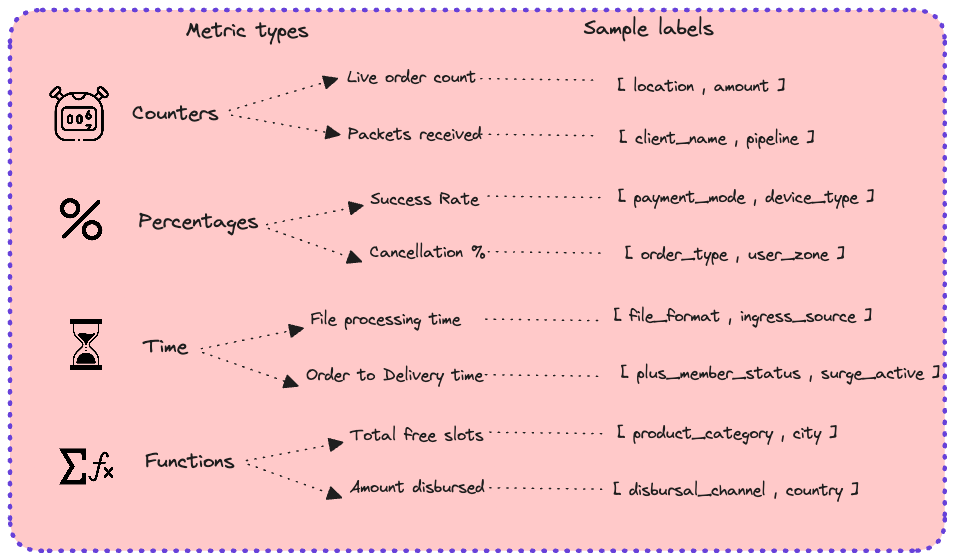
Often, to give more context to your metric, you will tend to add labels which would help you triangulate the impact radius in case of any anomaly. This could be something like adding a “city” wise split in your order count, “vendor” wise split in your success rates, “category” wise split in your processing time, etc. When reported an issue, these labels convert a typical metric into actionable insight to drill down upon.
Adding unique identifiers:
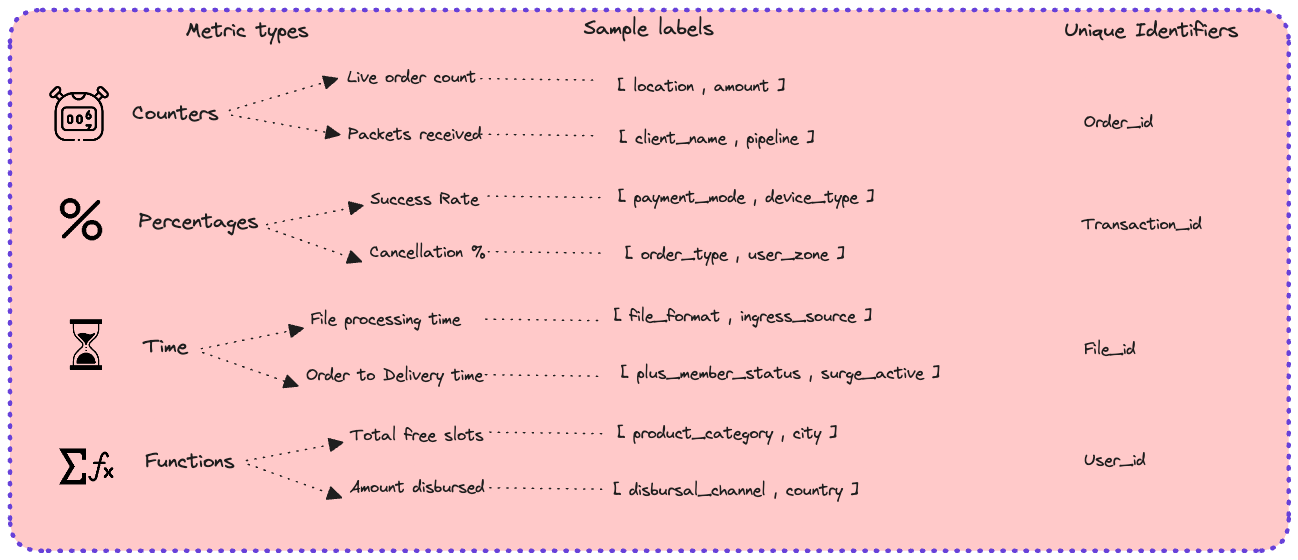
In some cases, not only is it important to track the metric, but it also becomes necessary to add a unique identifier to every signal. In these cases, adding custom logs with the labels as key-value pairs become the most recommended way.
Tracking custom metrics with Doctor Droid:
On Doctor Droid, we enable metric monitoring by creating aggregation on events received on the platform. An event is a data point in a structured key-value pair. Let’s extrapolate from the food delivery example mentioned above.
{
  "name": "order_initiated",
  "timestamp": 1677751161120,
  "payload": {
    "order_id": "ekpsHJ9GhQd7OU",
    "city": "Bengaluru",
    "store_code": "PZHT0056",
    "order_value": 435,
    "promised_eta": 23
  }
}
Using data like these, there are two types of metrics you can track on Doctor Droid — let me walk you through both of them.
Type 1 — Stateless metric:
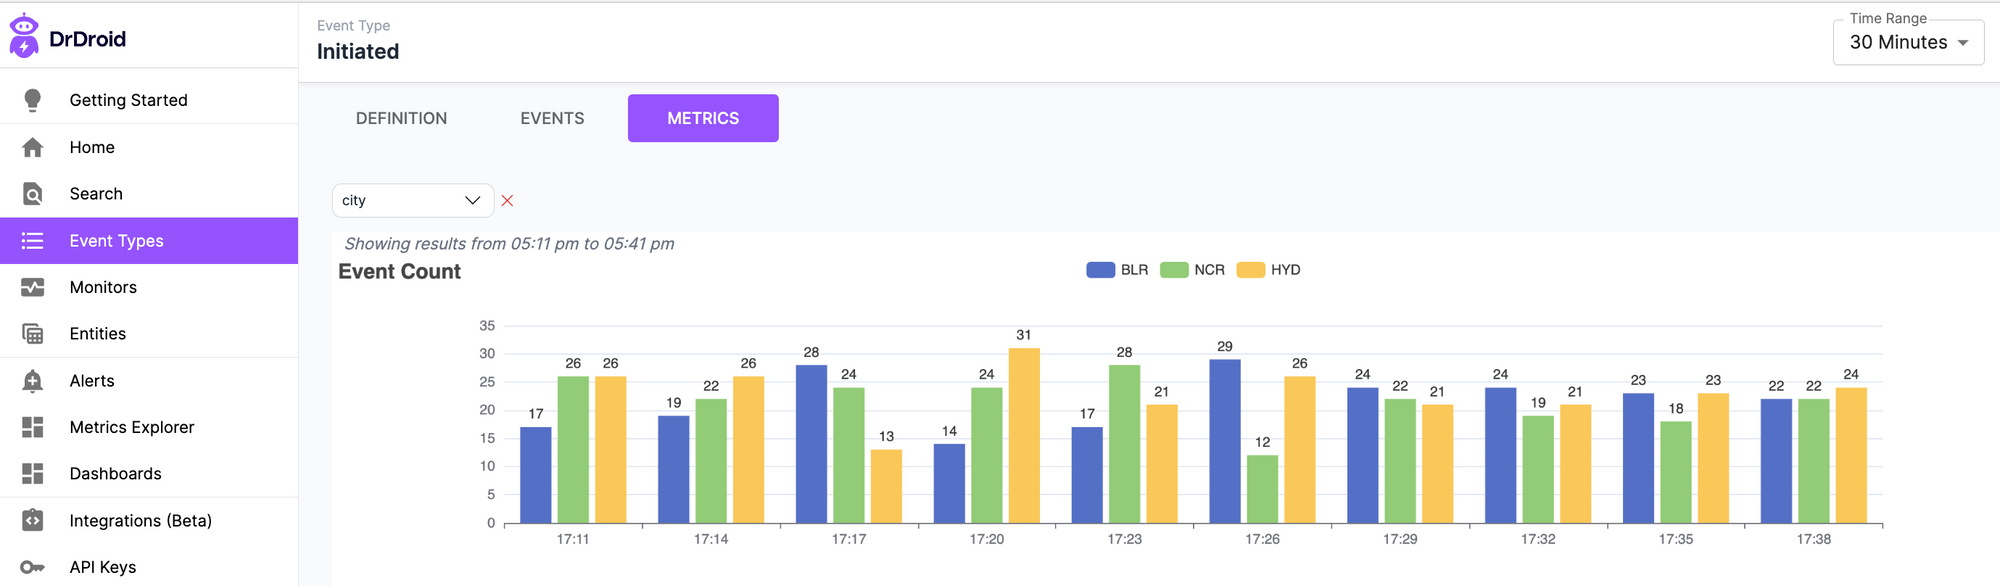
Any metric that is an aggregation on a single event and is a representation of a point-in-time checkpoint is stateless. As soon as the platform detects an event, it automatically generates relevant metrics. You will be able to see these by clicking an “Event Types” → “Metrics”.
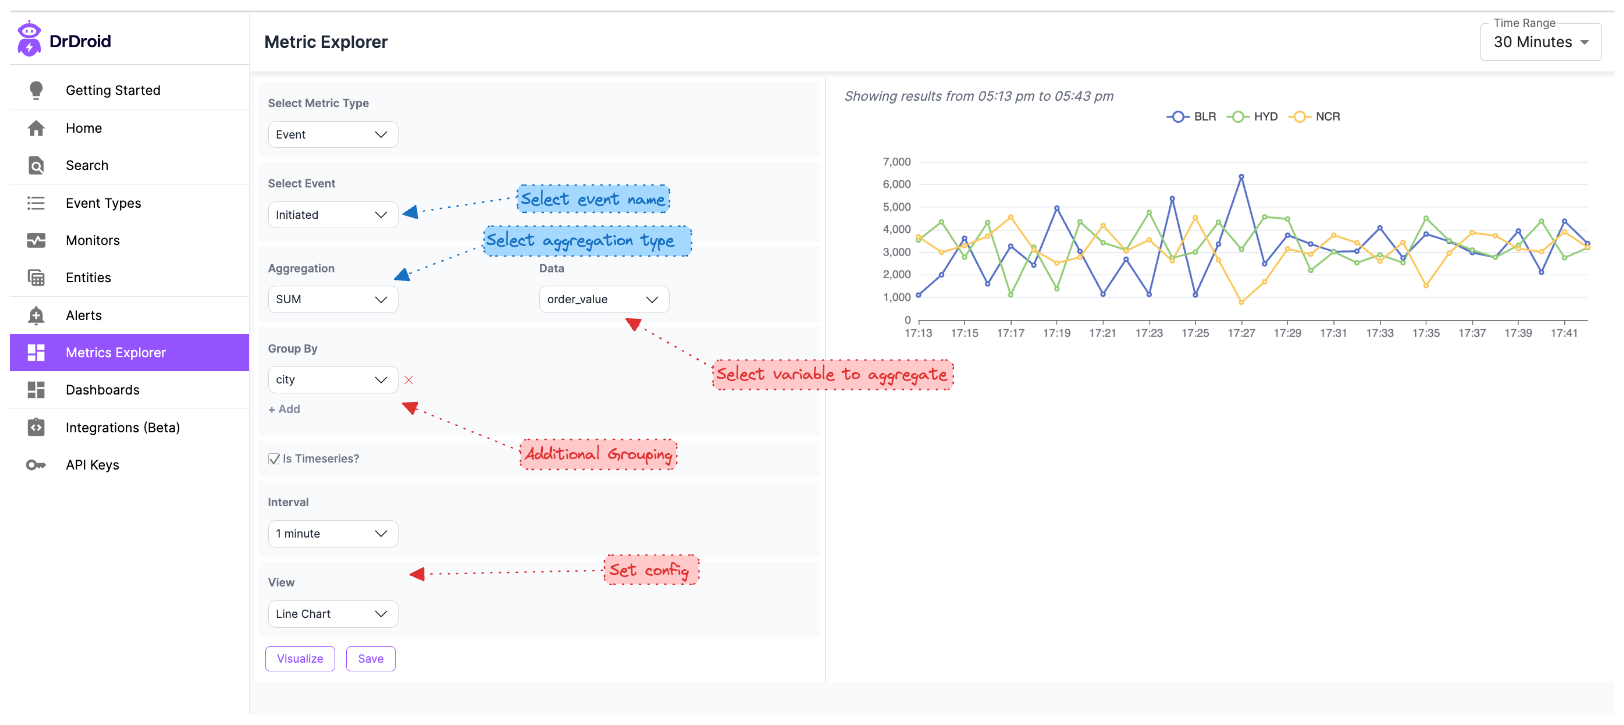
In case you want to create an alternate metric using the same data, you can leverage the Metrics Explorer.
Type 2 — Stateful metrics:
In continuation of the previous event (order initiated), let’s assume the next step in the journey of an order is the part when the order is allocated to a driver who would deliver the order.
{
  "name": "Allocation_successful",
  "timestamp": 1677751561100,
  "payload": {
    "order_id": "ekpsHJ9GhQd7OU",
    "delivery_eta": 14,
    "driver_id": 32432
  }
}
The time it takes from order initiation → allocation is a stateful metric that we want to track.
Firstly, define a Transaction in the platform.
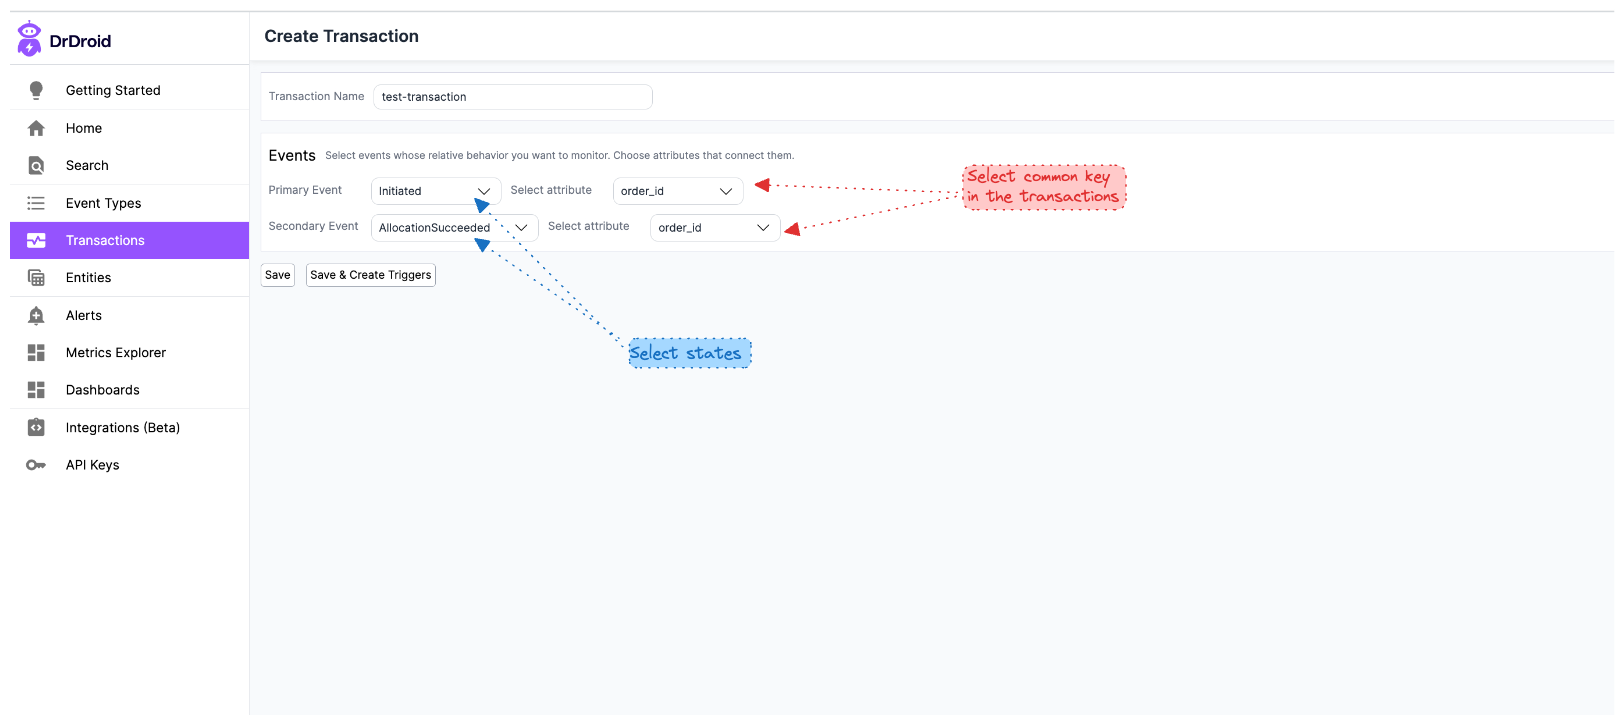
Now to plot a metric associated with the transaction, just go to Metrics Explorer and select “Metric Type” as “Transaction”.
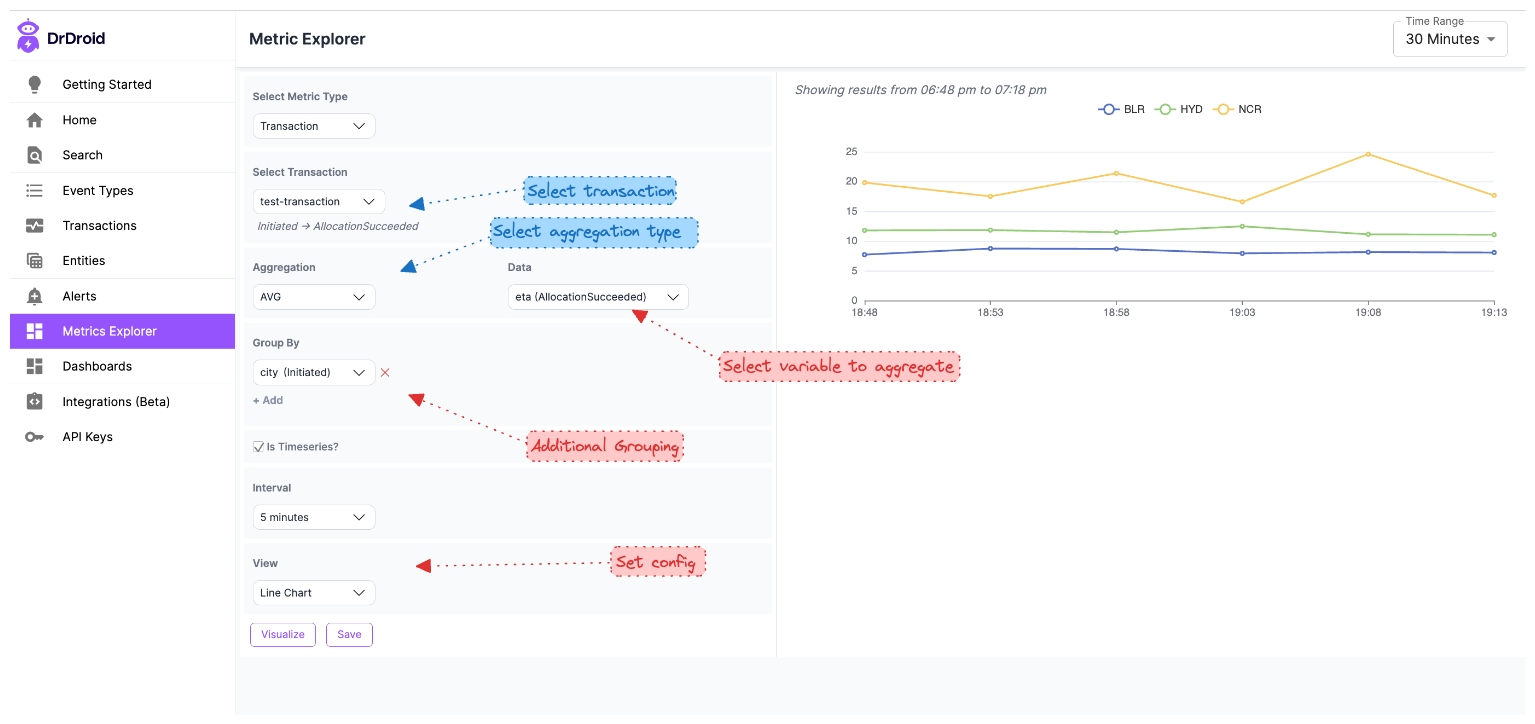
Note that we have plotted the variable from the second state but grouped it by the variable in the first state! You can also plot metrics that are not related to either of the states but about the correlation between them.
Additional benefits of using Doctor Droid:
Drill Downs
Double-click on a metric and you can see the underlying events/transaction data which created this metric, without having to write a new query.
You can add search and add filters by any of the parameters that might have been passed in the events.
Shareable dashboards
- With Doctor Droid, it’s easy to create shareable dashboards — this means, these dashboards are not restricted to only engineers who query it in ELK stack or Cloudwatch Log insights but are accessible to every leader as well as non-engineering team members that you want to share it with.
Understand impact radius and inter-dependencies
- Every metric in our platform can be mapped to a relevant entity. This means that you can identify the entities that are related to this metric (e.g. A payment success metric could be a part of an order entity), making it easy to go upstream / downstream and identify cascading effects.


