
Stateful Monitoring
An overview of how stateful monitoring can help correlate business goals and engineering metrics faster
Introduction
Every product’s execution or user’s interaction with it is a series of steps. These steps are either happening due to the user’s intent or are pre-programmed as a causal chain.
As developers, we are used to mentally looking at our product’s health as a sum of the health of each of these steps. These steps could be an API call, a background job or another task. The mapping of these individual components to the product goal is tribal knowledge, only stored as “mental models” and “mind maps” within the engineering team.
Triaging in Status Quo
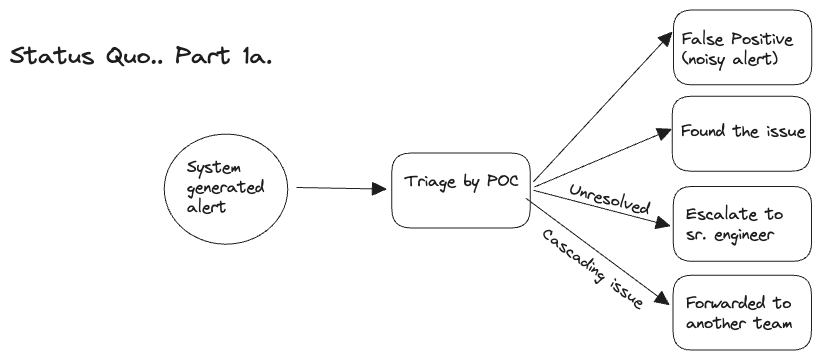
When our current monitoring tools tell some API is misbehaving (performance or exceptions), we scan through traces or logs to understand the origin of the issue. If an infrastructure component like a DB or cache gives us an alert, we check metrics being emitted from that component and try to estimate steps in the product which could be affected by it. Most likely, we can observe that effect in the monitoring dashboards. From the above information, you know something is broken for the end user but it’s hard to identify the impact radius as information is in silo.
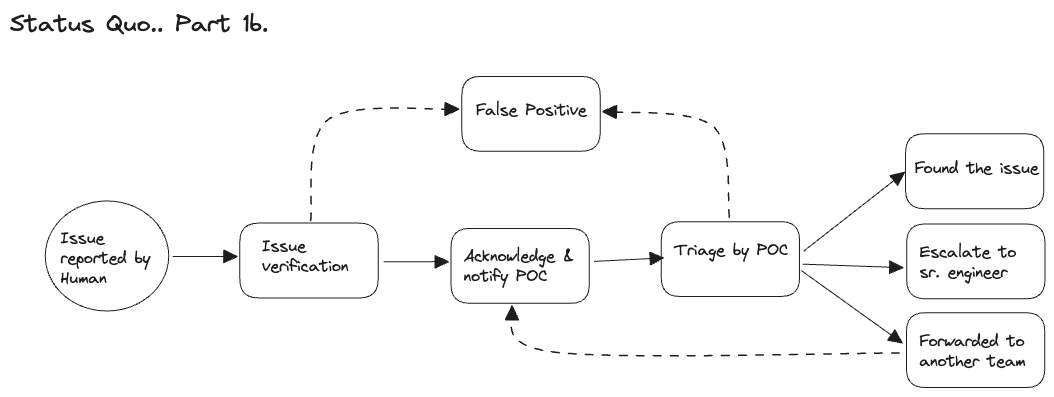
However, when someone external points out a user behaviour being impacted or some product metrics not being upto the mark, you need more information to find the root cause:
Mapping of that product’s lifecycle to the steps. Once steps are identified then you can drill down further.
The sequence of those steps in the product lifecycle, so that you know which misbehaviour in the product maps to which step, this information would make finding the root cause much faster given a complex system.
Stateful Monitoring
We are introducing stateful monitoring, an alternate way to look at your existing data. This adds a data interpretation and visualisation layer which understands your data as a state machine. It is like looking at your product lifecycle directly as a state machine of the steps. That way, misbehaviour in a step or an infrastructure component can tell you what is breaking for the end user.
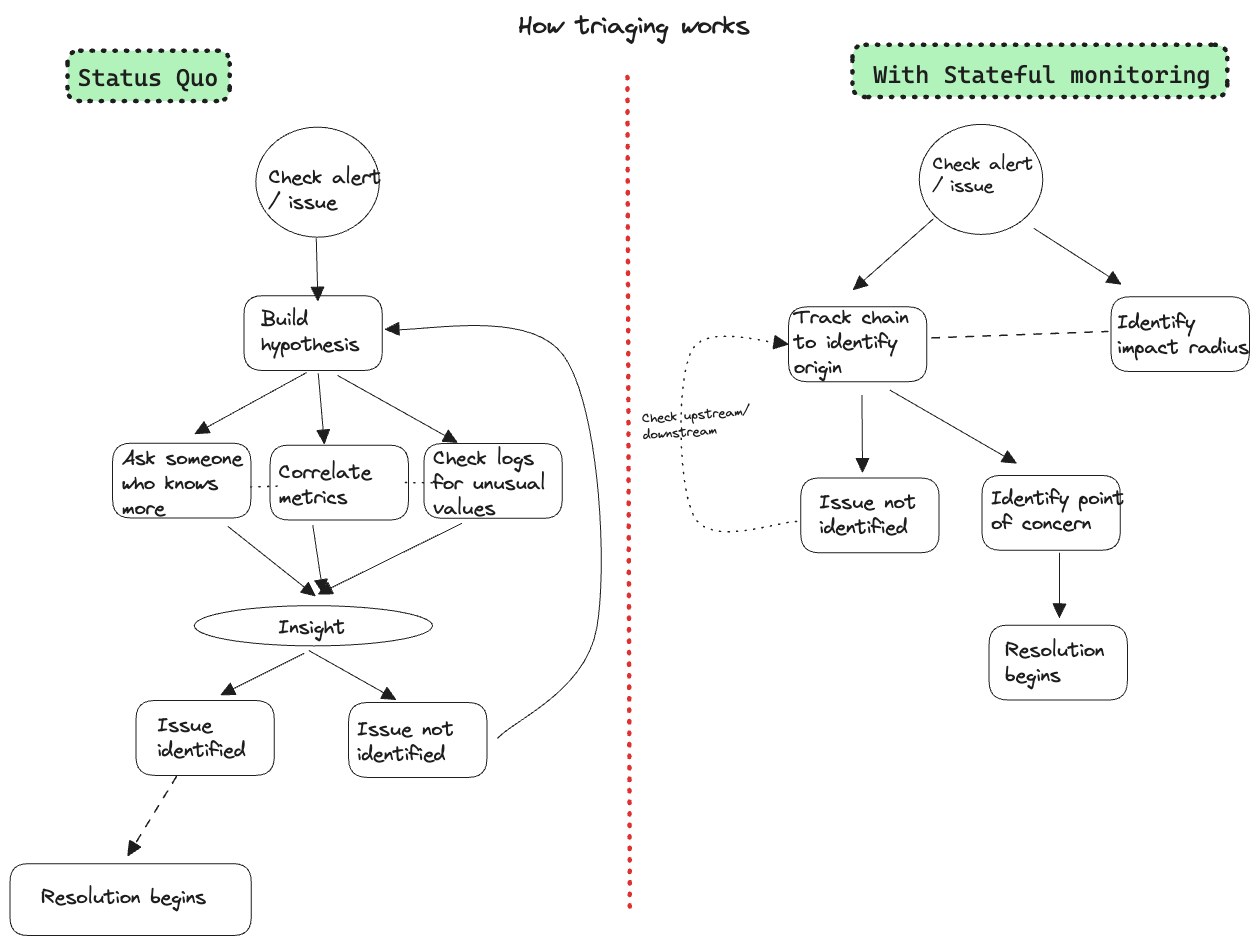
Similarly, when a user product issue is reported, you no longer need to know the mapping between the product and the steps, because you can see the entire product lifecycle together as a state machine diagram with each step’s metrics and their sequence patterns in front of you.
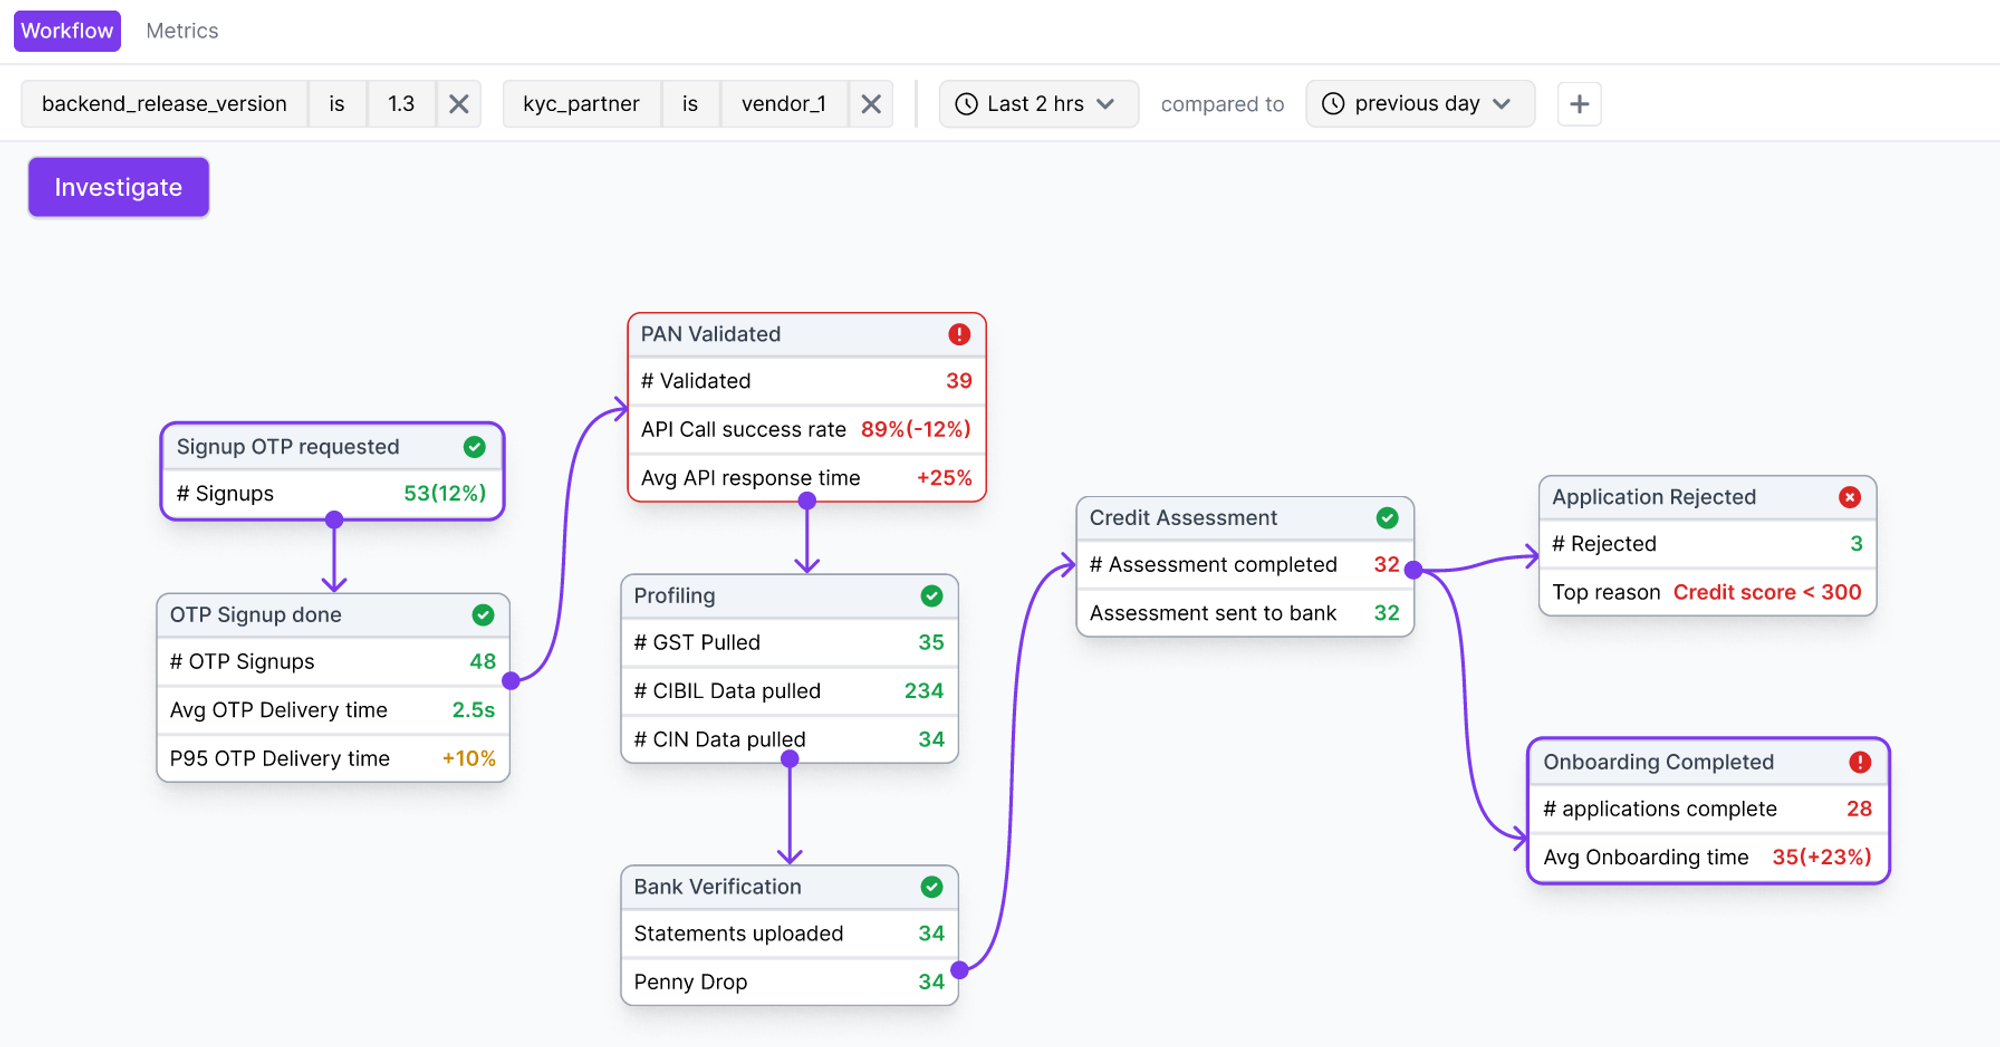
You can search within this state machine by using the property at any of the steps — this helps avoid the need to manually go through every checkpoint manually. For example, if the vendor of the user is only in one of the steps, if you filter by “vendor” = ”PayPal”, you can see the entire chain for each user who used PayPal. If you were to use a traditional tool, you will only be able to see the step which has the variable “PayPal” in it.
What you can do with a state machine:
Track the product use case against steps in your services. Helps in two-way mapping for impact radius as well as root cause analysis.
Set up monitoring on certain sequences/patterns/time taken in the state machine and set up alerts for % breach. This brings context into your alerts and removes alert fatigue.
Identify when a state machine is not reaching a terminal state in an expected time frame, signalling an anomalous behaviour that might need immediate attention.
Identify opportunities for improvement in your critical paths by identifying RDS (rate-determining steps).
The insights shared in this article are from our team’s experience in building and debugging products.
We are always keen to learn about how other engineers & organisations think about triaging and troubleshooting issues. Do share your ideas & inputs — we are reachable on any of our socials!